Soil EC (Salinity) — How to Interpret the Readings
Soil EC tells you more than moisture alone: how to interpret salinity and fertilizer concentration, which thresholds to set and how to read root-zone trends.
Zespół Nextriv4 min read

In this article
Measuring soil EC is the cheapest chemical analysis you can run continuously — and at the same time the one most often misread. Everyone understands moisture: dry or wet. EC, electrical conductivity, answers a harder and more valuable question — how much salt, including fertilizer, is circulating in the root zone. That value determines whether your fertigation is holding the recipe, whether the substrate is slowly salinizing, and whether the fertilizer is working in the roots or has leached beyond their reach. Below, we explain what an EC probe actually measures, what values are "normal" and — above all — how to read the trends, because they carry most of the information.
What EC is and what conducts current in soil
Pure water barely conducts electricity. What conducts are the ions dissolved in it: nitrates, potassium, calcium, magnesium, but also sodium and chlorides. The more salts in the soil solution, the higher the conductivity — which is why EC acts as a running total of everything saline: mineral fertilizers, salts naturally present in the soil, and those delivered with irrigation water. The result is expressed in microsiemens per centimeter (µS/cm) or millisiemens (1 mS/cm = 1000 µS/cm; the dS/m found in the literature is the same as mS/cm).
One caveat is crucial for interpretation: EC tells you how much salt there is in total, but not which salts. A high reading can mean a rich nutrient solution just as well as a harmful excess of sodium. That's why continuous measurement doesn't replace periodic laboratory analysis — it replaces the guesswork between analyses.
Measuring soil EC: what values are normal
First, the question of method, because that's where most misunderstandings start. A laboratory usually reports ECe — the conductivity of a saturated paste extract, i.e. a solution drawn from the sample. A field probe measures bulk EC: the current flows through a mixture of soil, water and air, so the readings are distinctly lower than ECe from the same soil. Comparing one directly with the other is the most common interpretation mistake.
Reference points, to be treated as orders of magnitude rather than dogma: the classic threshold above which soil is considered saline is an ECe of about 4 dS/m (4000 µS/cm); sensitive crops — like strawberry or bean — respond with yield loss much earlier, already around 1–2 dS/m, while tolerant species withstand values several times higher. The practical takeaway: calibrate internet tables against your own site. The same probe, in the same spot, in the same soil delivers readings comparable week to week and season to season — and it's that trend, not any single number, that decisions should rest on.

EC never walks alone: moisture and temperature
A bulk EC reading depends on soil moisture — and that can be misleading. As the profile dries out, the probe shows a drop in EC (less water for the current to flow through), even though the solution around the roots is actually concentrating. That's why EC is always read in tandem with moisture: compare readings at similar moisture levels, for example always after an irrigation cycle finishes, and check any sudden EC moves against the water chart first. Temperature adds its own effect, since conductivity rises with it — one more reason to measure all three parameters at the same point, with one probe. How to turn moisture alone into irrigation decisions is something we covered separately in our article on soil moisture monitoring.
Three interpretation scenarios from practice
1. Fertigation under cover. After a nutrient dose, EC in the root zone rises, then falls in a predictable rhythm as the plants take up the nutrients. If the baseline EC creeps upward week after week, you're applying more salt than the crop takes up and the water flushes out — the substrate is heading toward salinization. If EC falls faster than usual, you're probably overwatering and the fertilizer is escaping beyond the roots' reach. In a greenhouse, EC is one of several parameters governing growth rate — alongside climate and CO₂, which we covered in a separate article.
2. Irrigation water. Saline well water raises the EC background season after season — a single reading won't show it, a multi-year trend will. It's the chart that tells you when to flush the profile with a generous irrigation, and when to start a serious conversation about a different water source.
3. After rain. A sharp drop in EC accompanied by a spike in moisture means the rainfall has pushed salts deeper into the profile. For a salinity-sensitive crop that's a relief; for the fertilizer balance it's a loss worth factoring into the next fertigation dose.

A probe in the root zone: measuring so there's something to interpret
Interpretation is only as good as the measurement. The probe goes at the depth of the crop's root zone, at a representative point (not at the edge of a plot, not at or right next to a dripper emitter), with full electrode contact with the soil — an air pocket at the electrode will skew the reading. And above all: once chosen, the spot stays put for years, because the entire power of EC lies in comparability.
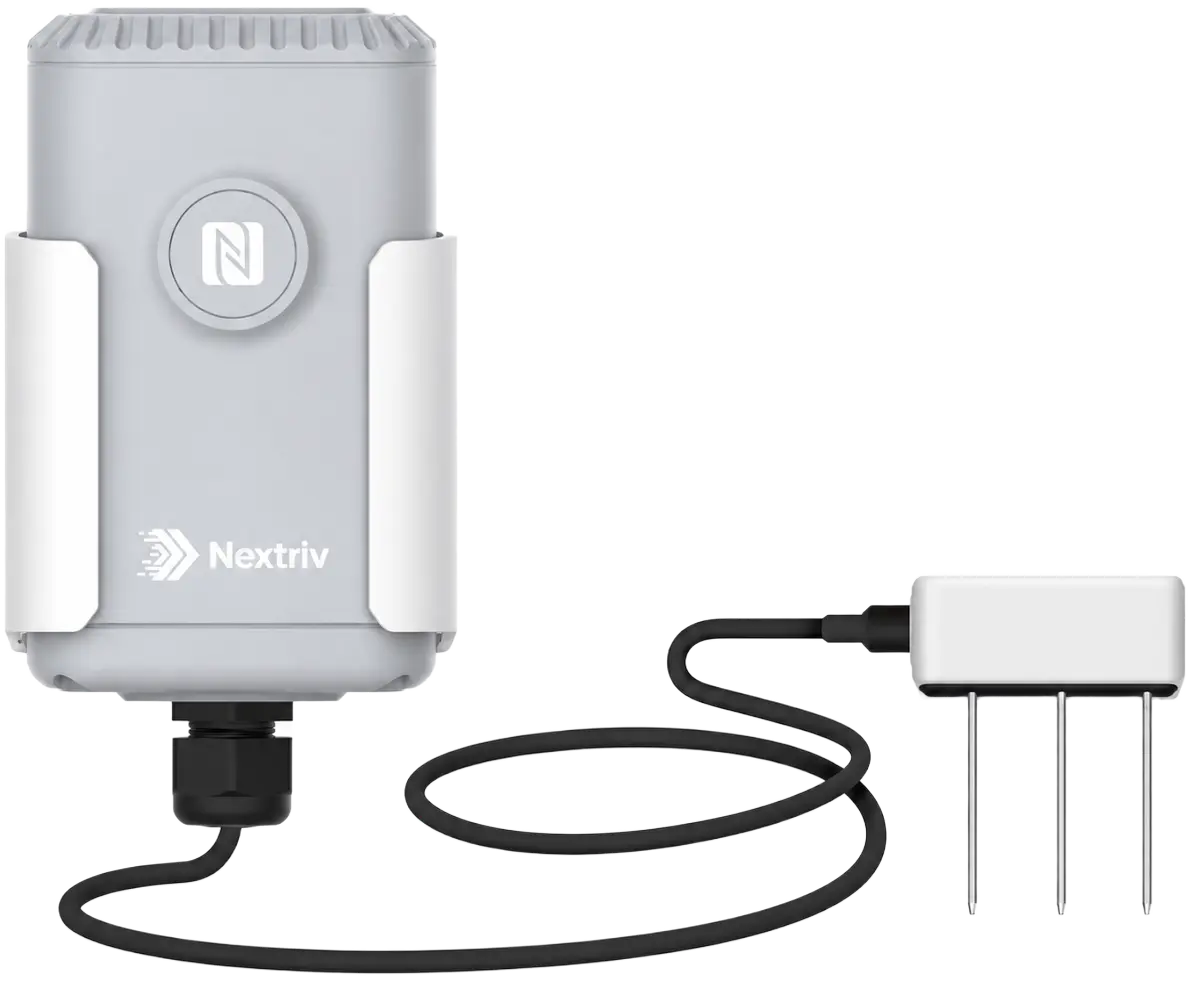
The Nextriv Probe Soil measures three parameters at once: EC up to 20,000 µS/cm (±3% up to 10,000 µS/cm — with headroom even for heavily salinized substrates), moisture to ±2% accuracy and temperature to ±0.5 °C. The sensing section, made of epoxy resin and stainless steel, is sealed to IP68 and works buried for years, including in chemically aggressive soils, while the surface transmitter reports over long-range radio — up to about 2 km in built-up areas and about 15 km in open terrain — so one gateway covers fields, tunnels and orchards at once. A buffer of around 1,000 measurements with retransmission closes data series after connectivity gaps, and the battery lasts up to 10 years.
Thresholds, alerts and seasonal takeaways
In the Nextriv platform, every metric gets four thresholds — for EC, a sensible start is a warning above the upper value of your fertigation recipe and a critical threshold at the crop's tolerance limit, plus moisture thresholds to plan irrigation. Notifications arrive by SMS, email or push before the plants show stress, and sensor comparison puts plots side by side on one chart — you can see immediately which one is falling out of rhythm. Measurement history with XLSX/CSV exports closes the season with ready-made material for analysis and crop documentation.
The full scenario — from a probe in the profile to irrigation automation — is described in our agriculture solution. The best way to start is one probe in your most troublesome plot and one season of data: check the pricing or book a demo, and we'll show you what an EC chart looks like in practice — fertigation spikes and salinity trend included.


