Light monitoring in museums — lux levels and exhibit fading
Light monitoring in museums: how many lux paper, textiles and paintings can take, what lux-hours are and how continuous measurement prevents fading.
Zespół Nextriv4 min read

In this article
Light monitoring in a museum begins with an uncomfortable truth: fading is irreversible and there is no remedial procedure for it. A flooded store can be dried out, an unsettled climate stabilised — but a pigment that has faded under light will not come back. The second uncomfortable truth is that light destroys quietly: not in a single incident, but by accumulating a dose day after day, season after season. This article shows how many lux the individual categories of exhibits can take, why a single light-meter reading says very little — and how to build continuous measurement that gives the conservator hard data to decide on.
Fading is arithmetic, not an accident
Light damage accumulates in proportion to the dose: light intensity multiplied by exposure time. Hence the unit conservation practice works with — lux-hours. An exhibit lit at 50 lux for 8 hours a day collects the same dose as one lit at 200 lux for 2 hours. That is why merely "dimming the gallery" does not close the subject: what counts is how much light the object really received over the whole exhibition season. Without measuring that value, you simply do not know it.
How many lux exhibits can take
Established conservation practice sets two main reference points:
| Object category | Recommended intensity |
|---|---|
| Most sensitive: paper, textiles, watercolours | approx. 50 lx |
| Oil paintings | approx. 200 lx |
The target values for a specific exhibition are always set by the conservator — but whatever limit is adopted, the cumulative dose remains the key. A gallery that "holds 50 lux" at the control measurement on Tuesday at 10:00 can look entirely different on a sunny afternoon, when daylight adds its share through the windows and skylights.
Light monitoring in museums in practice: continuous measurement instead of rounds
A lux meter in the conservator's hand shows a moment. Meanwhile the gallery's lighting changes constantly: the sun travels across the façade, curtains and blinds do their work, exhibition lighting gets switched on outside opening hours — for cleaning, photo sessions, evening events. Each of these situations adds lux-hours that no inspection round will ever see.
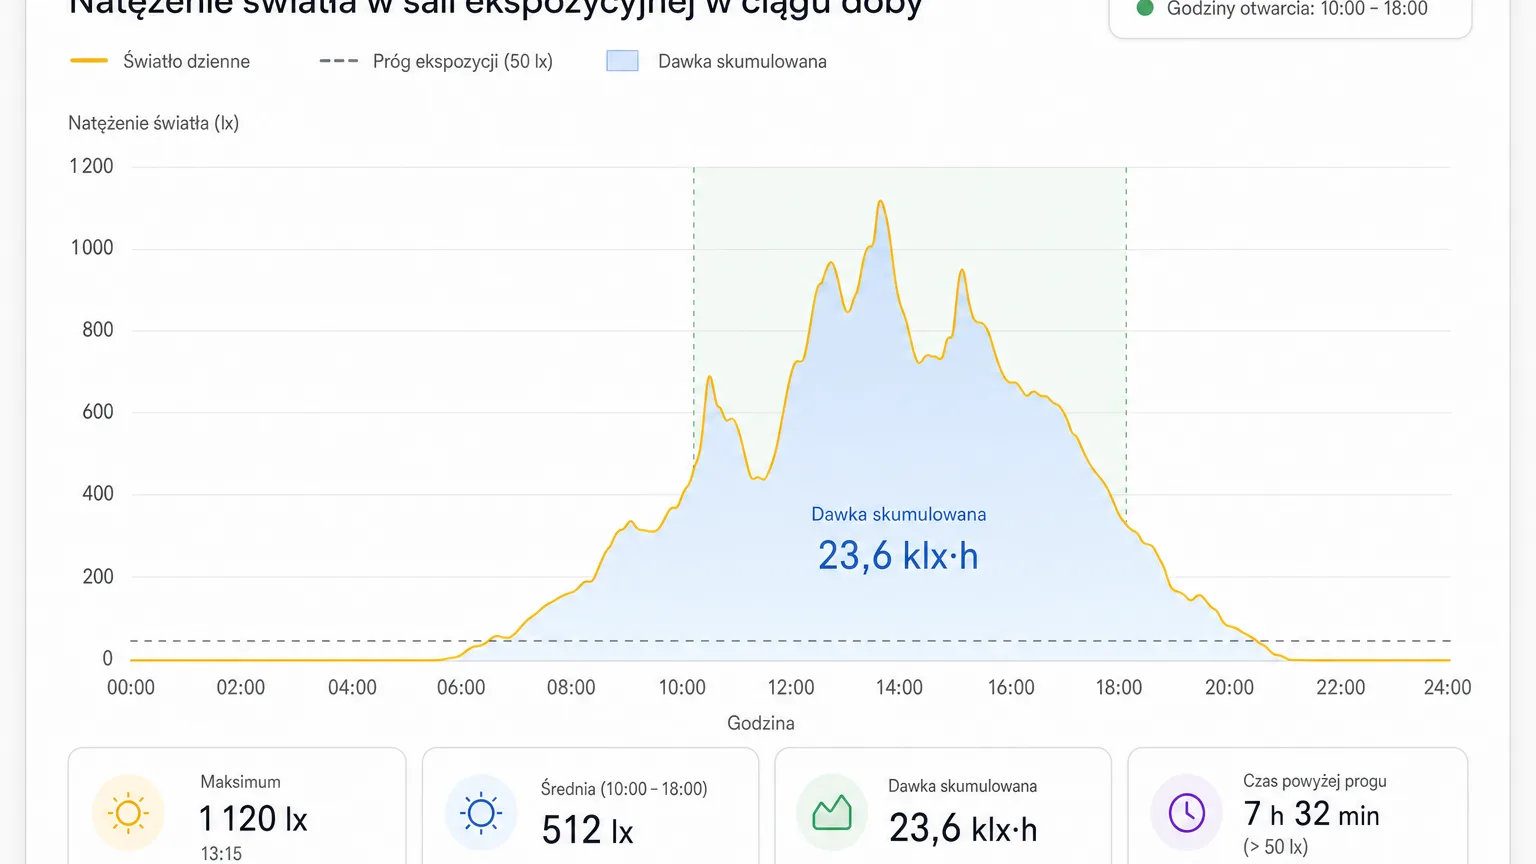
Continuous recording changes the perspective: instead of individual readings, you get the full intensity curve over time, from which the actual exposure of each display position follows. That is a hard basis for exhibit rotation and display limits — decisions that today are often made on intuition.
A sensor for conservation duty: 0–100,000 lx at ±3% accuracy
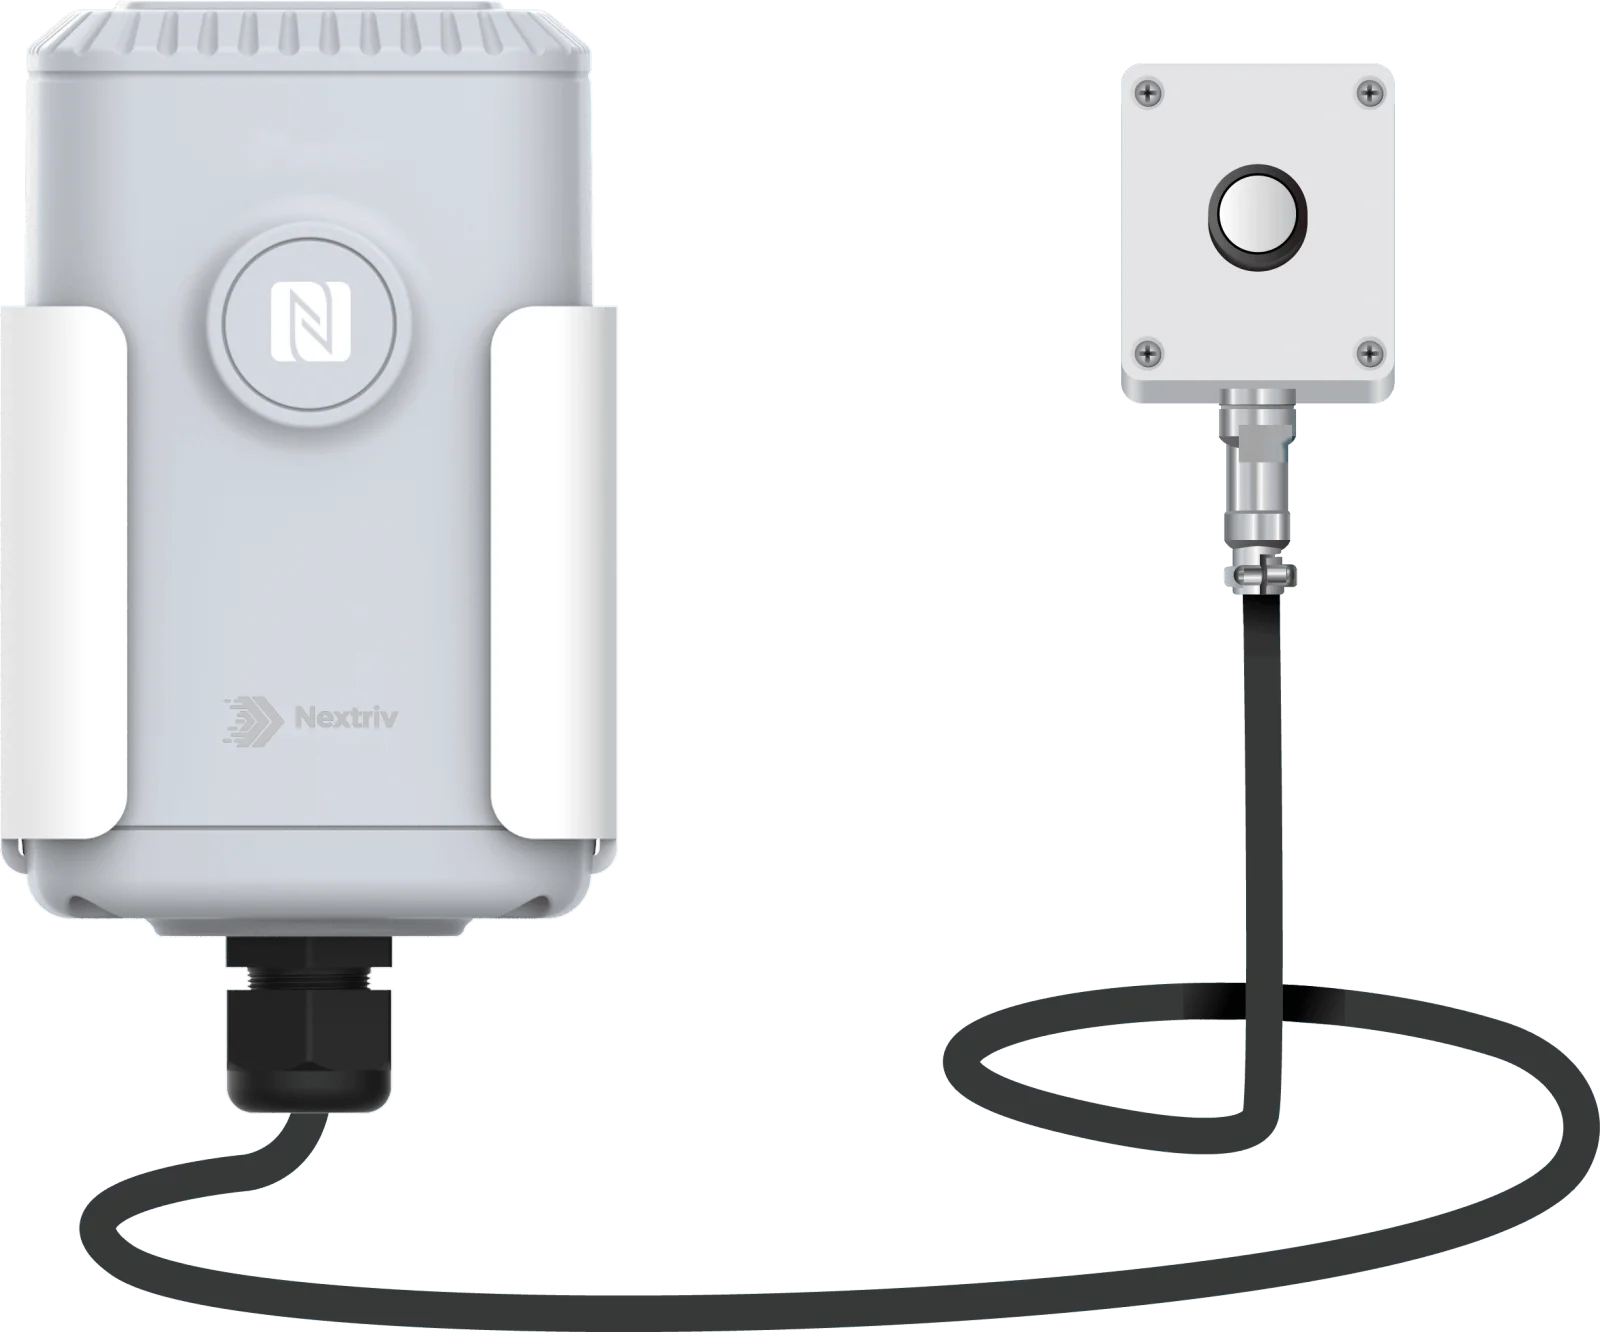
Controlling light in exhibition galleries requires conservation-grade measurement, not a rough estimate. Nextriv Sense Lux Pro measures intensity across the full 0–100,000 lx range with ±3% accuracy and 1 lx resolution — from the half-light of a store to full sun by a skylight.
Three features make the difference in museum practice:
- A light probe on a 3 m cable — the measurement point goes exactly where the light falls on the object: at the display case, on the wall next to the painting, under the skylight. The transmitter with the battery can be hidden out of visitors' sight.
- Response in about 1 second — the sensor catches even brief changes: a passing cloud, technical lighting switched on, curtains drawn open.
- Up to 10 years on a battery and local memory of 1,000 entries with retransmission — measurement without cabling and without gaps in the record, even after a connectivity outage.
If the gallery already has a Nextriv Sense IAQ 7-in-1 climate station, light intensity is measured alongside temperature, humidity and CO₂ — a good indicative measurement for the gallery as a whole. Where the dose falling on one specific, sensitive object is what counts, a dedicated light sensor with a probe remains the right tool.
From data to decisions: thresholds, rotation, documentation
Measurement is a means, not an end. In the Nextriv platform, light data works in three ways:
- Threshold alarms — exceeding the agreed intensity in a gallery triggers an immediate notification: email, SMS, web push or the team messenger. Someone left a window uncovered in the print gallery? You know straight away, not on the next round.
- Long-term trends — charts spanning weeks and months show which display positions collect the largest dose; an objective criterion for rotating exhibits and planning exhibitions.
- Documentation — measurement history reaches up to 5 years, and PDF reports with charts can be cryptographically signed (SHA-256 with a QR code). For inter-museum loans and conversations with the insurer, that is a document, not a declaration.
It is also worth remembering the hours when nobody is watching: lighting switched on for night cleaning, event rehearsals or photo sessions can add a surprisingly large share of the weekly dose. An alarm threshold set for outside opening hours catches every such situation automatically — along with how long it lasted.
Start with one gallery
A sensible pilot needs no building-wide project and no involvement of the technical department:
- Choose the most sensitive display position — a print, a textile or a watercolour in a gallery with daylight access is the natural candidate.
- Place the probe at the object — in the plane the light actually falls on, not by the ceiling; hide the transmitter outside the display.
- Agree the thresholds with the conservator — the intensity limit for the position and notifications outside opening hours.
- Record for two weeks — the first complete dose chart is usually enough to change how exhibition lighting is thought about.
- Decide on the data — adjust curtains and fittings, rotate objects, set exposure time limits.
The sensor is wireless, tape mounting does not disturb historic fabric, and NFC configuration from a phone takes a moment — a single-gallery pilot wraps up within an hour.
How light control combines with temperature and humidity oversight and leak detection into one system is shown on our page on climate monitoring for museums and archives. Want to see a light-dose chart on live data? Book a short demo — we will walk through the thresholds, the trends and the conservator's report on a real sensor.


