ROI of temperature and environmental monitoring — how to calculate the return
ROI of temperature monitoring in one hour: hardware and subscription costs versus avoided losses and manual rounds. Formula, model example, pitfalls.
Zespół Nextriv4 min read
In this article
The ROI of temperature monitoring is calculated differently from the return on a production machine. The system doesn't generate revenue — it removes risk and manual work. That's why the return calculation rests on two questions: what does not having monitoring cost me today (lost goods, hours of walk-arounds, documentation for inspections), and what does having it cost (hardware, subscription, rollout). In this article we show how to assemble a simple spreadsheet out of this: the formula, three sources of benefit, a complete model example and a list of pitfalls that most often ruin such calculations.
One reservation up front: all the numbers in this text are model examples — assumptions adopted for clarity of the calculation, not data from specific deployments. Your values will be different; the point of the exercise is to substitute your own.
The formula for temperature monitoring ROI
The formula itself is trivial:
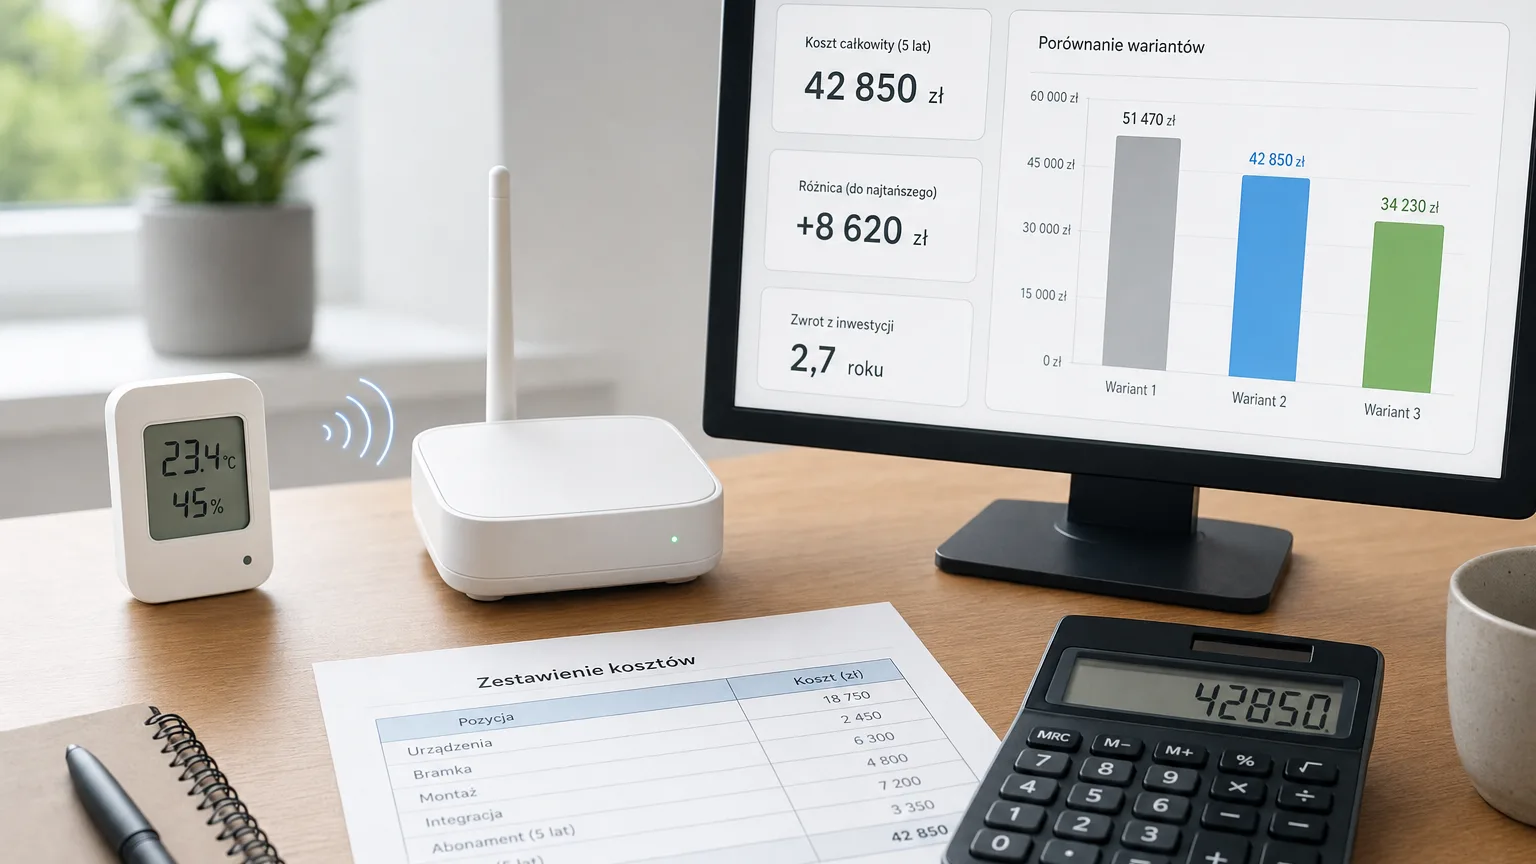
ROI = (annual benefits − annual costs) / initial outlay × 100%
and alongside it it's worth computing the payback period: the initial outlay divided by the net annual benefits. That's the second number the board will understand without explanation — "the investment pays for itself after X months".
The difficulty isn't in the formula but in the inputs. The cost side is easy, because those are amounts from the price list and a quote. The benefit side requires estimating events that didn't happen — and here most calculations either exaggerate (booking a catastrophe every year) or capitulate (booking zero). The sensible middle path is expected value: the cost of an event multiplied by a realistic annual probability.
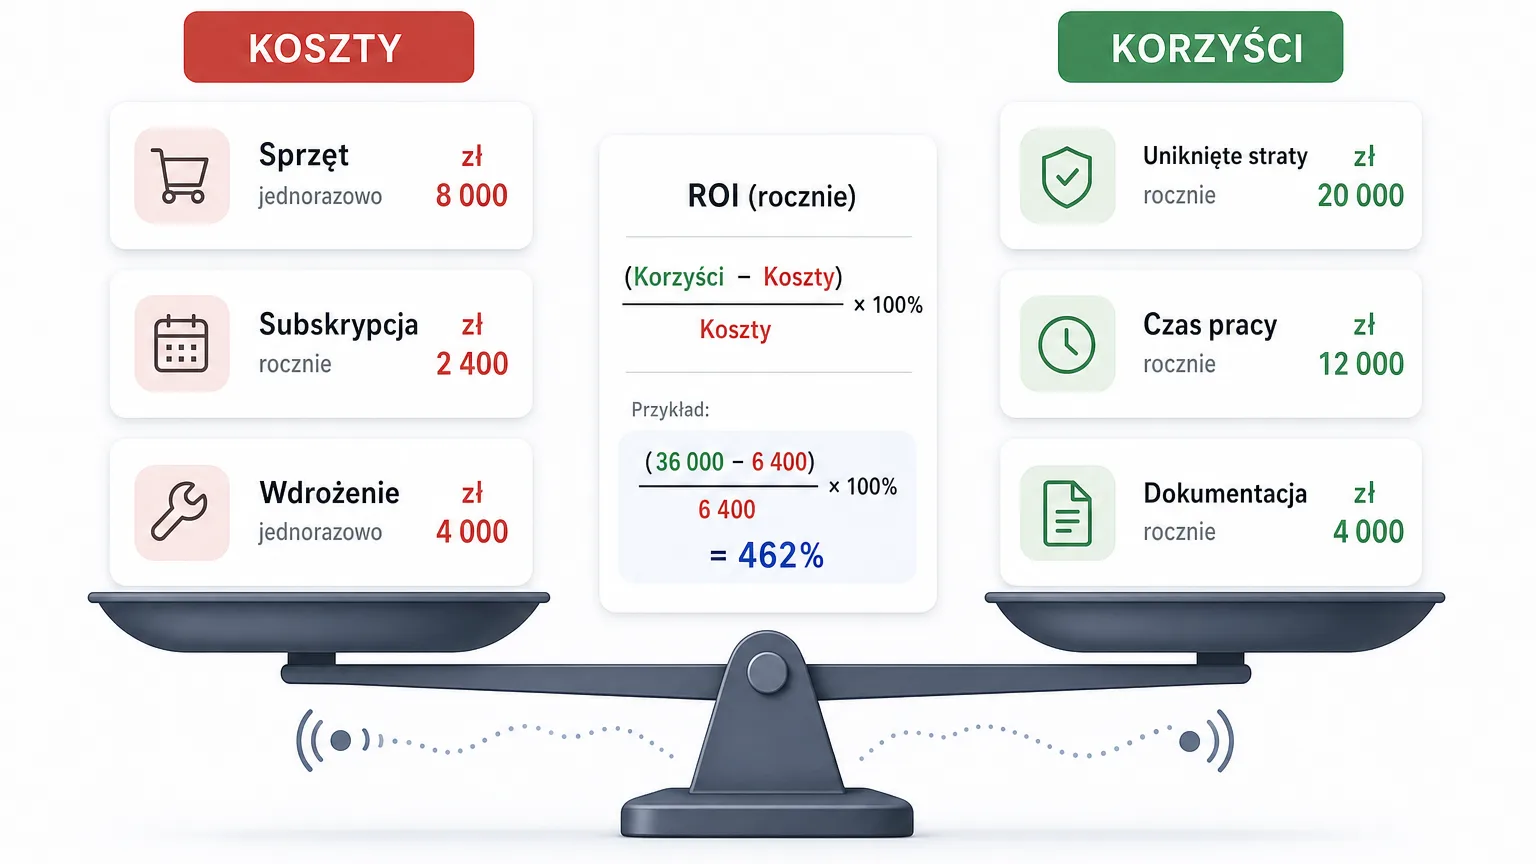
The cost side: three items
The budget of a wireless system consists of three elements — we break them down in detail in a separate article on monitoring system costs; here's the short version:
- Hardware (one-off): sensors and a gateway. Nextriv hardware is priced individually on request; put the amount from your own quote into the spreadsheet. The devices run at least 5 years on a replaceable battery, so there's no annual fleet replacement.
- Subscription (annual): the FREE plan costs 0 PLN and covers 10 sensors, 1 gateway, 2 users, 5 alert rules and a full year of measurement history. The PRO plan is 99 PLN net per 30 days or 990 PLN net per 365 days (excl. VAT) — no resource limits, with five-year history, escalation policies and a schedule of signed reports. Details in the pricing.
- Rollout: in the plug-and-play model you do the installation yourself — the gateway on USB-C or PoE, sensors with tape or screws, automatic device discovery in 30–180 seconds. For small and medium installations this item is realistically 0 PLN.
The benefit side: where the return comes from
1. Avoided loss of goods
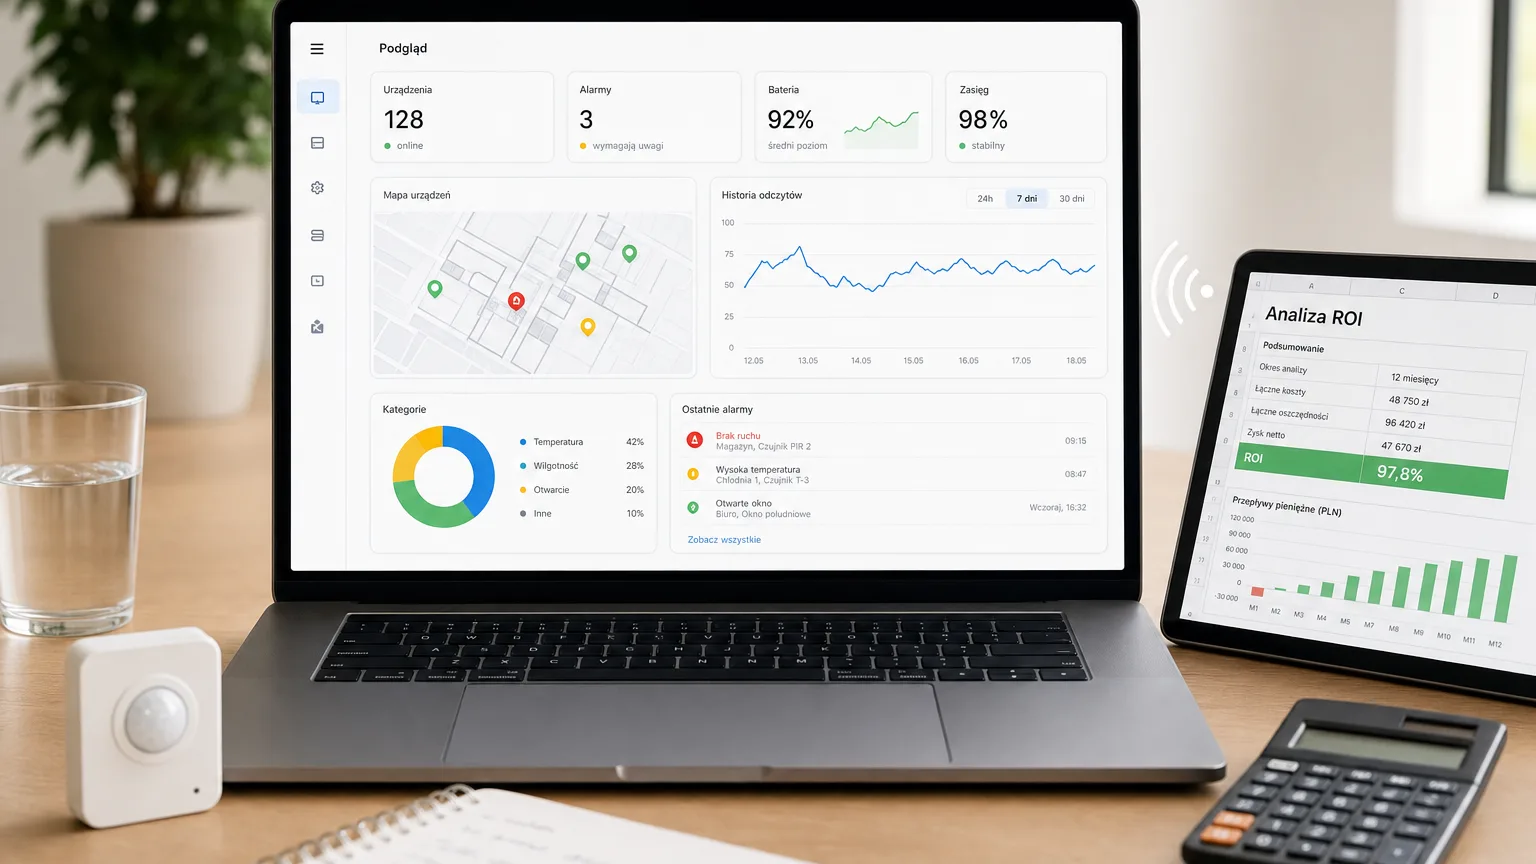
The heaviest item in the calculation. A condensing unit failing overnight, freezer doors left ajar, a tripped breaker — without monitoring, the problem surfaces hours later, when the goods are fit for disposal. With monitoring, the alarm arrives within minutes of the threshold being crossed (by SMS, email, push — there are six channels to choose from), so the real loss is usually limited to the cost of the response.
For the spreadsheet: estimate the value of goods at your most expensive refrigeration point, assume an incident frequency (once every 5–10 years is a conservative model assumption for a single refrigeration unit — substitute your own failure history) and assume that the early alarm saves most of the value.
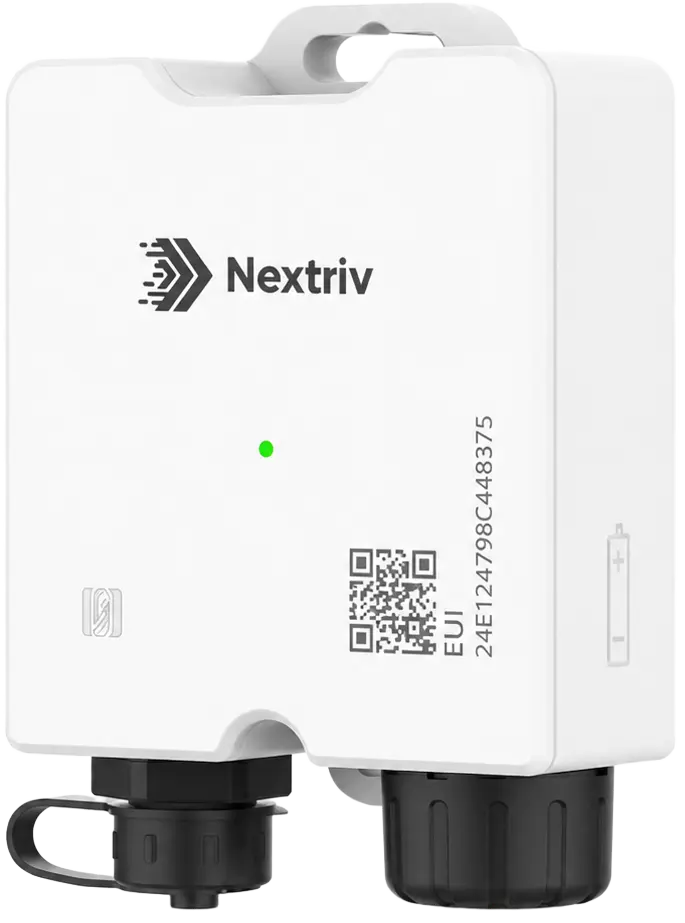
At the points where a loss hurts most — pharmacy refrigerators, display cases and cold rooms — a logger like Nextriv Probe Solo does the work: a probe in the chamber, a transmitter outside, a 4000-measurement buffer for connectivity outages and EN 12830 certification for the formal requirements.
2. The team's working time
A manual temperature log means walk-arounds: someone reads the thermometers two or three times a day and fills in the boxes. Calculate it directly: number of points × number of readings × time per reading × 365 days × hourly labour cost. The result surprises, because small minutes add up to dozens of hours a year — and automatic measurement removes them entirely, not selectively.
3. Documentation and inspections
The third source of return is the hardest to price, but real: the measurement history compiles itself, a PDF report for an inspection takes minutes instead of hours of digging through notebooks, and a continuous, gapless record strengthens the company's position in conversations with an inspector, auditor or insurer. If you can't price it — book just the time saved preparing for inspections and treat the rest as the calculation's safety buffer.
Model example: a pharmacy with a medicines refrigerator
The calculation below is a model construct — the assumptions are arbitrary and serve only to demonstrate the method.
Assumptions: 4 measurement points (two refrigerators, the dispensing room, the storeroom), the FREE plan (0 PLN), hardware — for the calculation let's conventionally take 3,000 PLN net from a quote; self-installation. So far: 2 readings a day × 4 points × approx. 1 minute = 8 minutes daily, i.e. about 49 hours a year; at a labour cost of 45 PLN/h that's about 2,200 PLN a year. Risk: goods in the refrigerators worth 15,000 PLN, a refrigeration incident once every 10 years, an early alarm saves 80% of the value — the expected value of the avoided loss: about 1,200 PLN a year.
| Item | Value (model assumption) |
|---|---|
| Initial outlay (hardware) | 3,000 PLN |
| Annual costs (FREE plan) | 0 PLN |
| Benefit: walk-around time | ~2,200 PLN / year |
| Benefit: avoided losses | ~1,200 PLN / year |
| Total benefits | ~3,400 PLN / year |
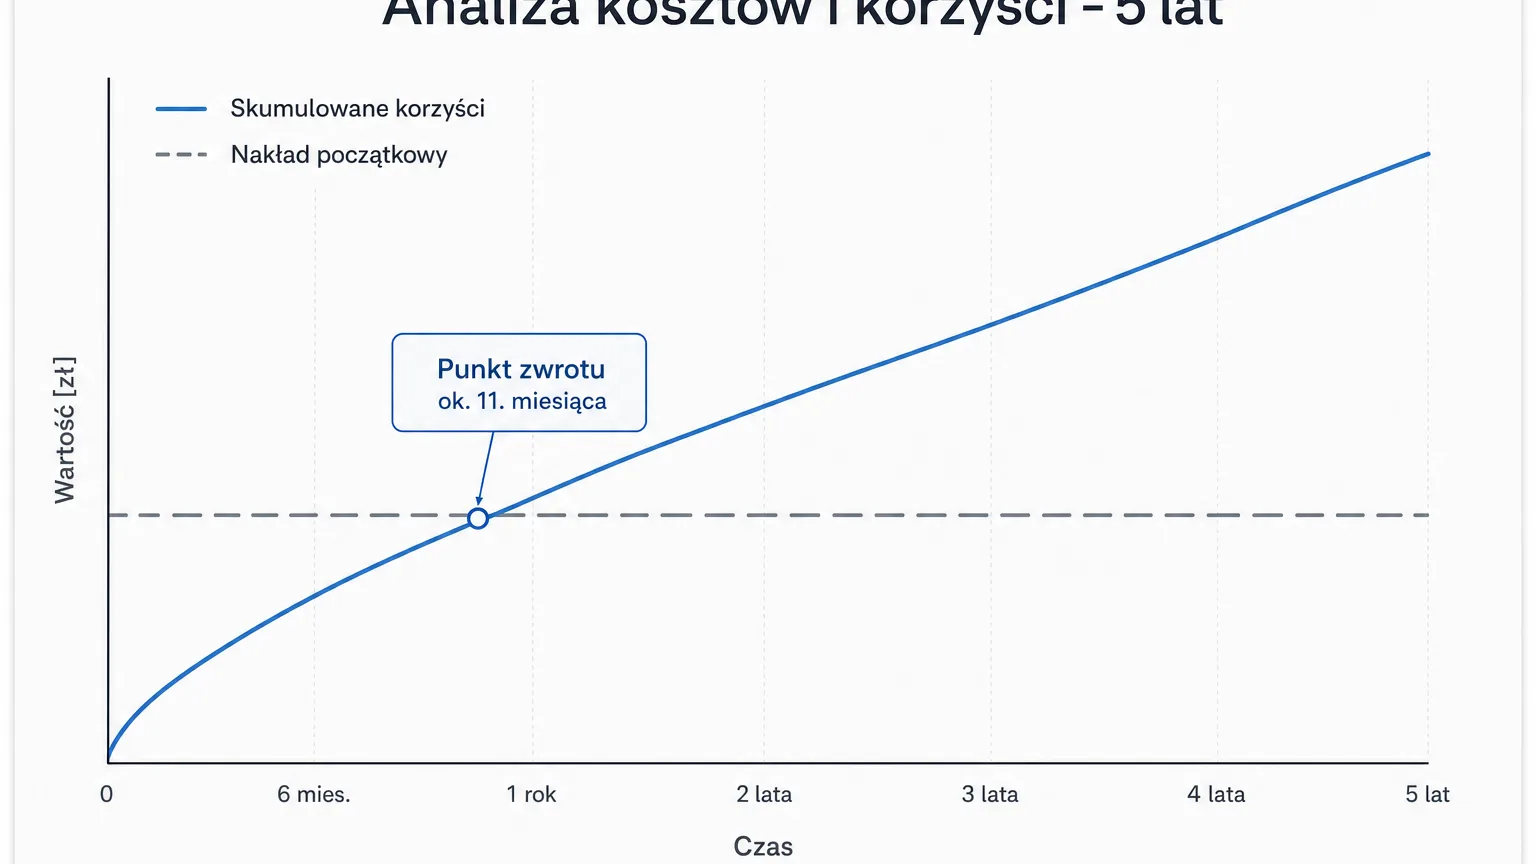
Payback period: 3,000 / 3,400 ≈ 11 months. Over a 5-year horizon (at least as long as a sensor battery lasts) the total benefits come to about 17,000 PLN against a 3,000 PLN outlay. Even if your numbers turn out half as high, the calculation stays positive — and exactly that resilience to pessimistic assumptions is the best test of any calculation.
Pitfalls that ruin the calculation
- Booking a catastrophe every year. If you enter the full loss of goods as an annual benefit, nobody will take the spreadsheet seriously. Use expected value and conservative frequencies.
- Ignoring the costs of the status quo. A paper log costs too: time, errors, the risk of entries being challenged. A zero on the "do nothing" side is the most common methodological error.
- Pricing soft benefits. Leave "peace of mind" and "image" out of the spreadsheet — let the calculation stand on hard items and treat the soft ones as a bonus.
- Comparing sensor prices alone. Total cost over a 3–5 year horizon is decided by subscription and rollout; an offer with cheap hardware can get expensive through per-user fees or SMS surcharges.
- Ignoring scale. With 4 points the FREE plan settles the matter for 0 PLN; with 25 points PRO enters the calculation (990 PLN net per year) — still under 83 PLN a month, but an honest spreadsheet has to include the item.
Summary
Temperature monitoring ROI is a one-page calculation: a hardware outlay (quoted on request), a subscription from 0 PLN and three sources of benefit — avoided losses, recovered time, cheaper documentation. In the model pharmacy example the investment pays back in about a year, and every following year works in the black. Substitute your own numbers, compare the plans in the pricing — and if you want to see exactly what you get for those amounts, book a short demo and we'll calculate your variant together.