Air quality and team productivity — what the data shows
Air quality and team productivity: how CO2, TVOC and particulate matter affect concentration — and how to verify it with data from your own office.
Zespół Nextriv4 min read

Air quality and team productivity are linked in a way everyone knows first-hand: an hour in a stuffy meeting room and even the best agenda turns into a fight to stay awake. The trouble is that in budgets this relationship doesn't exist — ventilation is accounted for under energy costs and people under results, and nobody sets one against the other. Yet it is precisely staff costs that dominate an office's books: even a small percentage of output lost to bad air is worth more than the entire HVAC bill. Below we look at what research says about the relationship — and, more importantly, at how to check it on data from your own office instead of taking anyone's word for it.
Air quality and productivity: what the research shows
The influence of the indoor environment on mental work has been studied for decades — from the classic work on thermal comfort to newer experiments with controlled concentrations of CO₂ and volatile compounds. With the caution due to varied methodologies, the direction of the findings is consistent:
- Elevated CO₂ concentrations go hand in hand with poorer performance on cognitive tasks — especially the complex ones: planning, decision-making, working with many pieces of information at once. Effects have been observed at concentrations that are an everyday reality in offices and schools, not an anomaly.
- Better ventilation correlates with better performance and lower absence. Studies comparing buildings with different air exchange rates report fewer complaints of "sick building syndrome" symptoms, less sick leave and better office-work performance where there is simply more air.
- Temperature outside the comfort band reduces the pace and accuracy of work — overheating and overcooling alike. It is the best-documented single environmental factor.
- Particulate matter acts more slowly but more broadly: long-term exposure to PM2.5 is a documented health risk factor which, at organisational scale, translates into sickness absence.
An honest caveat: the specific percentages from individual studies vary with method, population and task type — which is exactly why it isn't worth basing decisions on a single number from a press headline. That doesn't change the practical conclusion: air is a measurable productivity factor, not a soft add-on to the benefits package.
The mechanism: what exactly gets in the brain's way
Behind the catch-all label of "bad air" sit several different mechanisms, each with its own metric:
CO₂ and "stale" air. Carbon dioxide concentration rises with every minute of breathing in a closed room — and with it the bioaerosol load and the general feeling of stuffiness. The comfort limit has stood at around 1000 ppm for over a century; a typical meeting room crosses it within half an hour of a meeting. How fast, and which thresholds to set, is something we break down in detail in the piece on CO₂ in meeting rooms.
Temperature and humidity. The comfort band for office work is conventionally 20–26 °C and 40–60% relative humidity. Winter's over-dried air — dry mucous membranes, irritated eyes, static-charged clothes — generates complaints and micro-breaks that nobody puts on the books.
TVOC. Volatile organic compounds from furniture, carpets and cleaning products add headaches and irritation — the classic symptoms of sick building syndrome. Here the trend is what counts: a jump in the index after a refurbishment or a change of cleaning company shows up on the chart immediately.
PM2.5/PM10 particulates. In smog season, an office on a busy street can have indoor air barely better than the air outside — if the supply-air filtration can't keep up. Without measurement nobody knows, because particulates can't be seen or smelled.

Instead of other people's studies — data from your own office
The strongest argument in a conversation about ventilation is not a meta-analysis but a chart from your own meeting room. The experiment that impresses every board looks like this:
- Hang a multi-parameter station in the places people complain about — the big meeting room, the densest part of the open-plan area, the training room. The placement rule: one sensor per 100–200 m² zone plus one in each key room (more on this in the guide to office air quality).
- Collect data for a month without changing anything. The charts will reveal the rhythm of the day: CO₂ peaks during meeting hours, afternoon overheating of sun-exposed zones, Monday TVOC spikes after the weekend clean.
- Set the data against the calendar and the complaints. The meetings after which "everyone is wiped out" almost always coincide with breaches of 1400–2000 ppm. That juxtaposition — the chart next to the room's calendar — closes the debate over whether the problem exists.
- Make one change and compare. Airing between meetings, a longer air-handler run-on, adjusted setpoints — and after two weeks a before-and-after comparison of the curves, from the same sensors.
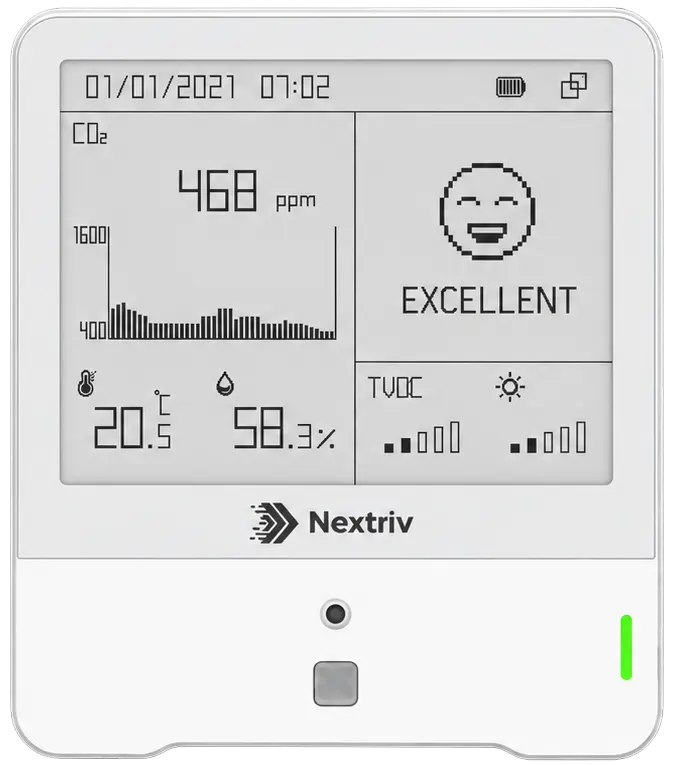
One device per zone is enough for such a measurement. The Nextriv Sense IAQ Comfort station measures eight parameters at once — temperature, humidity, CO₂ (optically, using NDIR), TVOC, laser-measured PM2.5/PM10 particulates, pressure, light and occupancy — and its e-ink screen with an emoticon gives the team feedback on the spot, with no logging in anywhere. The motion sensor also lets you cross-reference air quality with the rooms' real usage while you're at it.

From data to decisions
Measurement turns a conversation about comfort into a conversation about numbers — and the platform makes sure the numbers don't require daily check-ins. Alarm thresholds (up to four per metric) send notifications where the facility manager actually works: by email, SMS, web push, in Microsoft Teams, on Discord or as an audible in-app alarm. Dashboards with nearly 20 widget types set zones side by side, and scheduled PDF reports with a summary and charts land on the board's desk as hard material for decisions about ventilation, filtration or space planning. XLSX/CSV exports will feed any internal analysis — including one that sets the air against HR data.
How this looks at the scale of a whole building — from common areas to tenant reporting — is described in our solution for buildings and offices.
Run the numbers for yourself
The arithmetic is simple: a measurement station costs a fraction of one workstation's monthly cost, and the free plan — 10 sensors, a gateway, a year of measurement history — adds not a single złoty for software. A month of data is enough to know whether your rooms are working for the team or against it.
Check the pricing or book a short demo — we'll show you charts from an office like yours and alerts that react before the team starts yawning.


