
How Often Should You Measure Temperature? Four Intervals Explained
Learn how to choose a temperature recording interval from process dynamics and risk while separating sampling, reporting, threshold checks and offline detection.
Zespół Nextriv6 min read
“How often should we measure temperature?” sounds like a question that ought to have one convenient table: a refrigerator every 5 minutes, a warehouse every 15, an office every hour. That answer would be easy to use and often wrong. The interval needs to reflect how quickly the monitored environment can change, how long a change can last before it matters, and how much time the team needs to respond. A modern monitoring design also needs to separate at least four moments: taking the measurement, storing or reporting it to the platform, checking the threshold when the result arrives, and declaring that data is missing. Treat them as one setting and you may get a dense chart but information delivered too late — or a fast notification based on data that does not represent the right process.
There is no universal interval for every industry
WHO guidance for mapping and monitoring temperature-controlled storage calls for a frequency capable of capturing meaningful change. It does not prescribe one sampling interval for every product and room. The EU Good Distribution Practice guidelines likewise base control on risk, qualification and the conditions in the particular facility, rather than a magic number of minutes.
That makes physical sense. Air in a small refrigerator can change within seconds after a door opens, while product represented by a thermal buffer responds much more slowly. A large tank has a different time constant again, and comfort in a meeting room does not require one-second resolution. The same interval can therefore be wasteful in one location and miss a material event in another.
Start with four questions:
- What is the fastest event you need to see? A refrigeration failure, a door opening, a defrost cycle and gradual cooling degradation all happen on different time scales.
- What is the time constant of the monitored object? An air probe reacts faster than a probe in a buffered bottle, a cold-room wall or a mass of product.
- When does the event cause meaningful harm? The permitted time outside the range matters, not just the chart's visual width.
- How long does response take? If a technician needs 30 minutes to arrive, an alarm sent after 45 minutes fails its purpose regardless of sensor accuracy.
The four intervals that should be separated
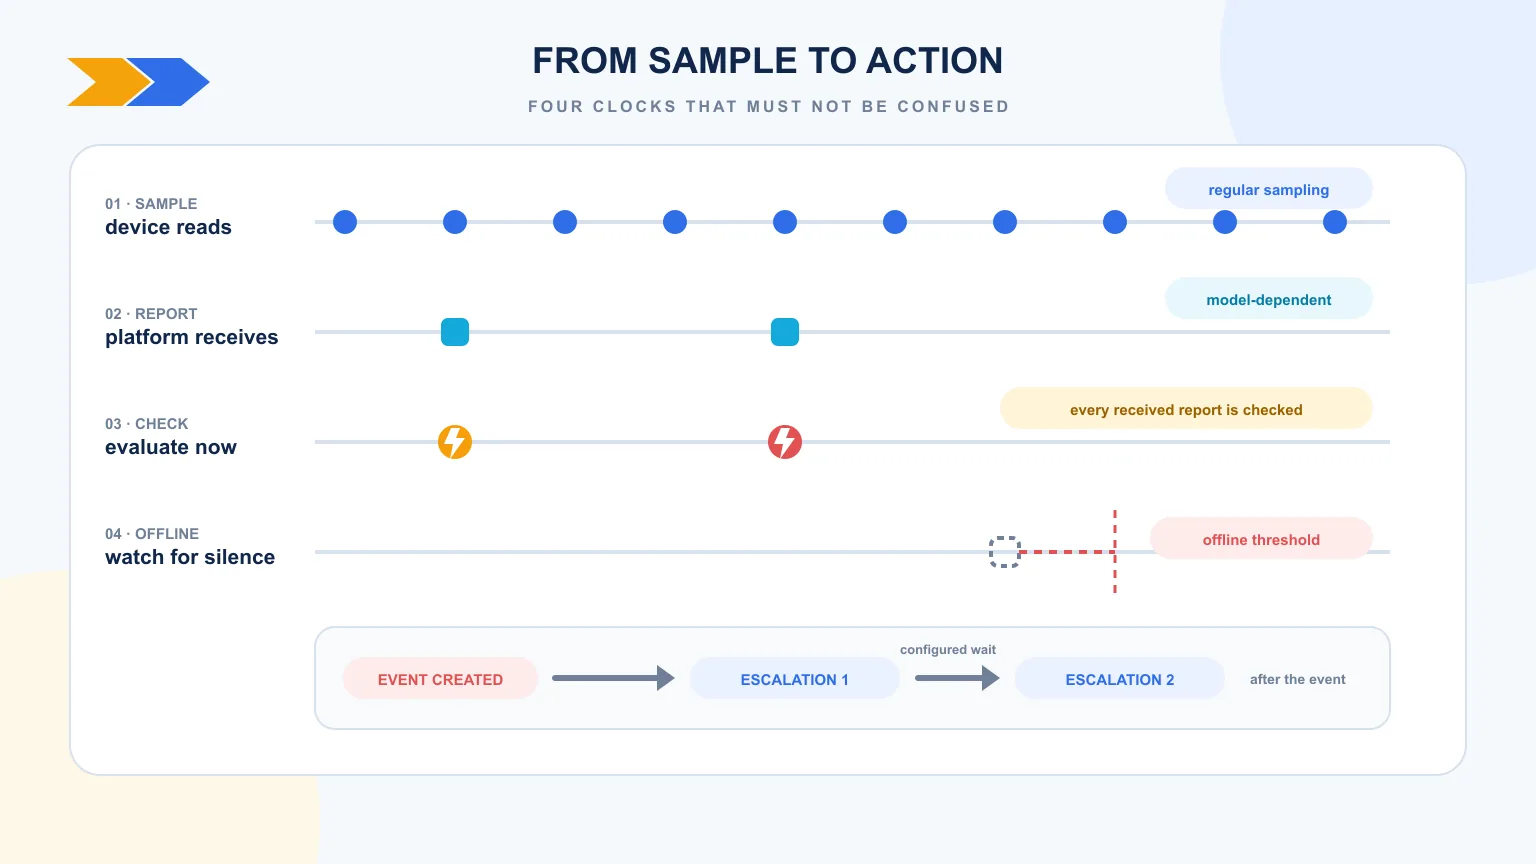
The sampling interval says how often the sensing element reads the value. It determines whether a short spike enters the data at all. Sampling and reporting should only be treated as separate settings when the device model genuinely supports more frequent sampling, local timestamped storage and less frequent transmission. On other devices, one report is simply one measurement.
The storage or reporting interval says how often a result reaches device memory or the platform. Some models measure more frequently and transmit a batch less often to conserve battery and radio capacity. That design preserves evidence only when this mode is documented and the local buffer stores values with their original timestamps. Without it, less frequent reporting simply means less detail.
Threshold evaluation and escalation are different stages. Nextriv evaluates every reported value immediately and creates an event when it detects a threshold excursion; the platform does not apply a pre-event trigger delay, debounce or hysteresis. Configurable timing applies to later escalation steps after the event has been created. If a procedure recognises an excursion only after a specified duration or series of results, duration must be assessed from the history under that procedure or implemented in separately validated device or control logic — it should not be assumed to exist in a simple platform threshold.
The offline threshold answers a different question: how long can the system remain silent before supervision is no longer credible? It should follow the expected reporting rhythm and tolerate an isolated delay, but it must not be so long that failure appears only at the next manual round. Nextriv can derive an automatic threshold from the reporting interval; our guide to wireless range and sensor status explains the wider connectivity context.
Calculating a defensible starting point
Instead of selecting “the popular 10 minutes”, begin with the shortest material event. If a procedure treats a 30-minute excursion as requiring action, recording every 30 minutes is too sparse: the event may begin just after one sample and only become visible almost an hour later. Several points within the relevant window are needed to establish the start, duration and direction of change.
A useful engineering rule — not a legal standard — is to record clearly more often than the shortest process you need to recognise. Then verify the assumption in a trial. Open a door for the normal delivery period, disconnect refrigeration under controlled conditions, simulate a communications loss, and observe when the measurement, report, threshold event, notification and offline state appear. This exercise is part of a deliberate commissioning process; a similar approach underpins warehouse temperature mapping.
Illustrative starting points may look like the following, provided they are subsequently validated:
| Scenario | What drives the interval | Typical configuration direction |
|---|---|---|
| Small refrigerator or critical chamber | fast door events, low air mass, short response window | sampling in minutes; assess brief openings from the trend and procedure |
| Large-volume warehouse | slower change, warm and cold zones | several to a dozen minutes after mapping the locations |
| Office comfort | occupancy and ventilation patterns | several to a dozen minutes, interpreting trends rather than isolated peaks |
| Soil, silo or large tank | high process inertia | a longer interval unless the alarm concerns a rapid event |
| Leak, door contact or digital input | state changes are event-based | immediate state-change message plus a periodic health check |
This table is not a substitute for qualification. “Every 5 minutes” with an air probe and “every 5 minutes” with a buffered probe describe two different processes.
More frequent is not automatically better
A shorter interval increases the data volume, energy consumption and radio traffic. It can also expose more apparently important peaks that are simply noise or a normal operating cycle. An unnecessarily aggressive configuration reduces battery life — the relationship between reporting and energy is explained in our article on wireless sensor battery life.
That does not justify saving resources by averaging away extremes. An hourly mean can hide a brief excursion. When a system builds aggregates for quickly viewing multi-year trends, raw readings should remain available for incident analysis. This matters especially in compliance reports and is covered in more detail in our guide to measurement data retention.
Validating an interval in five steps
- Define the event the system must detect and its shortest meaningful duration.
- Establish the measurement point's time constant and the team's maximum response time.
- Separate sampling from reporting only if the device supports that mode; approve the value threshold, immediate evaluation of each report, post-event escalation and offline threshold.
- Test a controlled excursion and a communications failure.
- After a week or one complete operating cycle, review the data, alarm count and battery impact; document any adjustment.
In regulated environments, the outcome should become part of qualification or validation records. Elsewhere, it is still worth recording the rationale — six months later, nobody will remember why a device reports every 3, 10 or 30 minutes.
What to record in the configuration rationale
A short configuration record needs more than the value “10 min”. Record the device version, location and probe installation, sampling interval, reporting interval, buffer capacity, value thresholds, timing of subsequent escalation steps after an event, expected offline threshold and notification recipients. If the model does not separate sampling and reporting, record one common interval rather than inventing a capability. Add the scenario used to test the configuration, the test date and the approver.
Also define what happens when circumstances change. Moving a probe from air into a thermal buffer, replacing a refrigerator, shortening the response time or introducing a new product type can invalidate the original assumptions even when the number of minutes stays the same. The change should trigger reassessment, not only an edit to a field in the dashboard.
Finally, set criteria for periodic review: nuisance-alarm count, longest data gap, time from excursion to notification and battery impact. This makes the interval a measurable decision. Overly dense recording can be relaxed on evidence, while sparse reporting can be shortened before a real incident exposes the weakness.
One configuration does not need to remain valid indefinitely. Summer conditions, changed operating hours or an altered installation can change the dynamics of the monitored environment. A planned review after such changes prevents a setting that was correct at acceptance from becoming unsuitable a year later.
Nextriv brings devices with different reporting rhythms onto one dashboard and keeps value alarms separate from missing-data alarms. Every received report is evaluated immediately; any timing applies only to subsequent escalation steps after the event. The how it works page shows the full path from a sensor to the platform. If you want to choose settings for a specific chamber or process, book a demo — we will begin with the risk scenario, not a canned number from a table.


