Webhooks and API — getting measurements out of monitoring into your own systems
Webhooks and API in monitoring: how to route measurements and alerts to helpdesk, BI or building automation. Webhooks, API, MQTT and file exports.
Zespół Nextriv4 min read

In this article
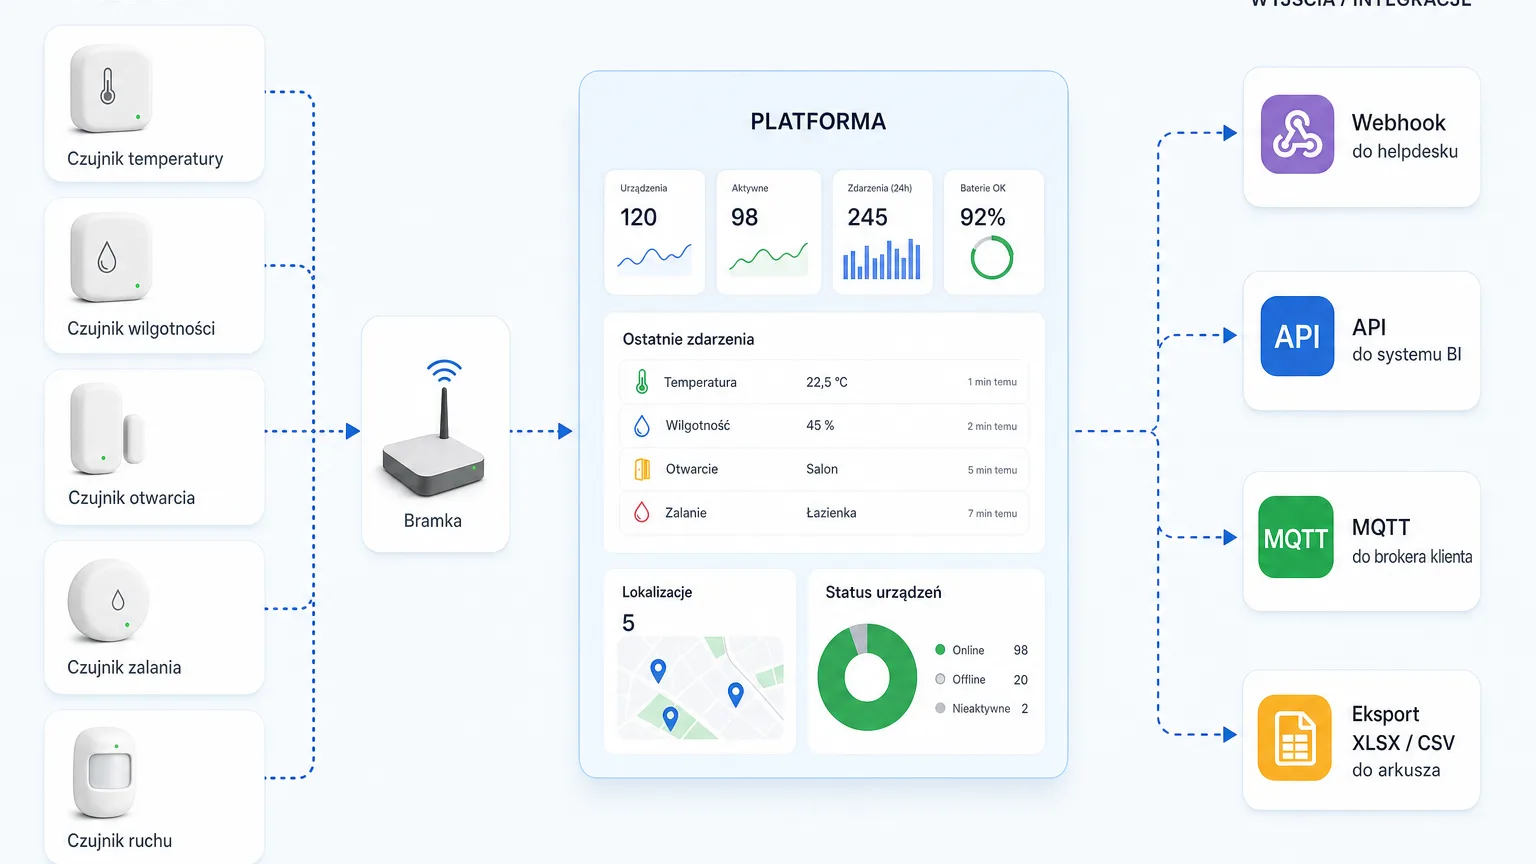
Webhooks and API are the moment monitoring stops being a separate application and becomes part of the company's bloodstream. A dashboard full of charts is great to start with, but the real value of measurements shows up where the team already works: an alarm from the cold room should open a helpdesk ticket on its own, hall temperature data should feed the corporate BI, and building automation should react to events with no human involved. In Nextriv there are three exit routes for data — webhooks, API and MQTT — complemented by classic file exports. Below is the overview: which route for what, on concrete scenarios.
Direction of flow: a closed inlet, a wide outlet
Before the integrations themselves, one sentence about the architecture, because it organises everything that follows. Data enters the Nextriv platform by one route: from Nextriv sensors, through Nextriv gateways, over long-range radio. The only exception is existing third-party analogue sensors (4–20 mA, 0–10 V), which you connect through a gateway with industrial inputs. There is no public endpoint through which anyone could "pour in" measurements from outside — that is a deliberate security decision.
Data leaves, on the other hand, broadly: via webhooks, the API, an MQTT stream, file exports and reports. Integrations in Nextriv always mean taking data out into your systems — and that is exactly why you can design them boldly, with no risk of anyone getting inside the same way.
Webhooks: an event in monitoring triggers an action at your end
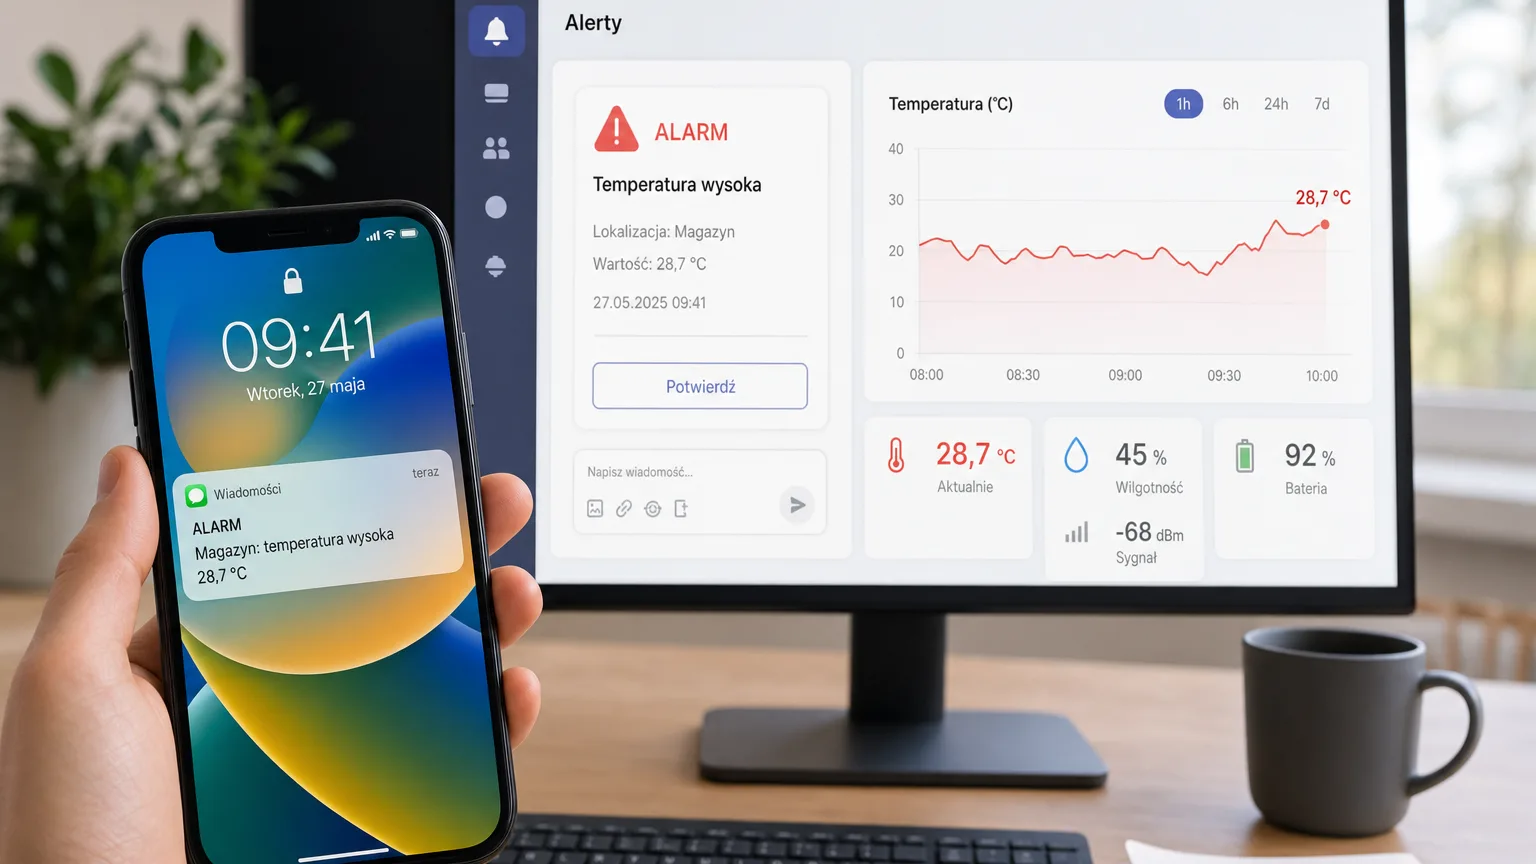
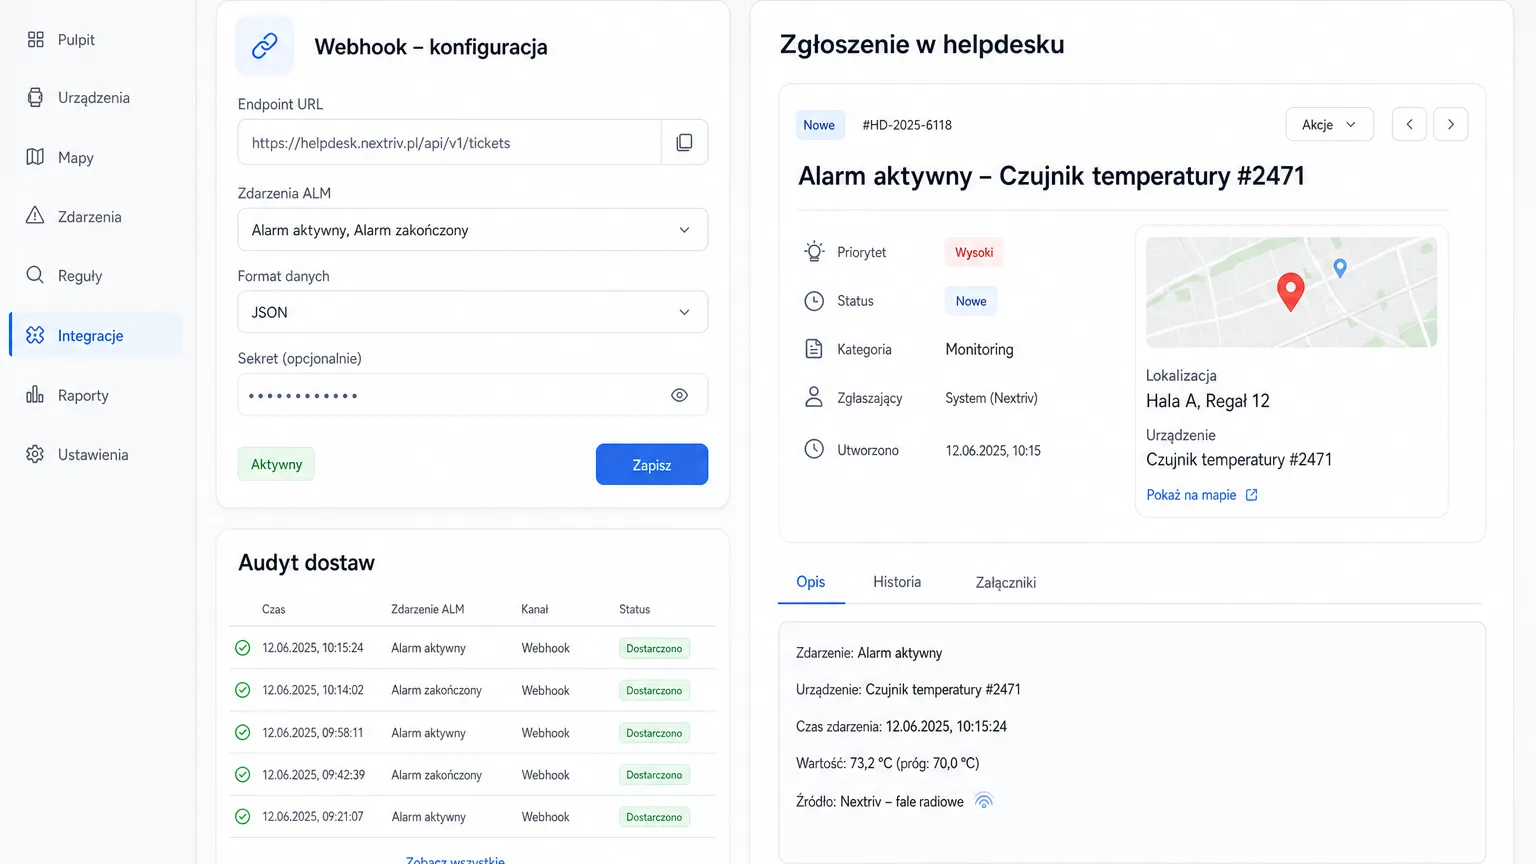
A webhook works like a doorbell: when an alert event occurs in the platform, Nextriv sends an HTTP request to an address you specify — with the full event data. What you do with it is entirely up to the receiver: typical scenarios are an automatic ticket in an internal helpdesk, an entry in a maintenance management system, or lighting up a physical beacon on the shop floor.
The power of webhooks lies in reversing the initiative. You do not poll the platform asking "has anything happened?" — the platform tells you the moment something does. That is why webhooks naturally complement the notification channels: email, SMS or web push inform people, while a webhook fires up systems at the same instant — how to arrange the whole alarm path is described in our overview of notification channels. In fact, two of those channels, Discord and MS Teams, are technically webhooks themselves — the alert lands straight on the team's channel; the on-call scenarios built on that basis are laid out in the article on Discord and Teams alerts.
Practical advice: a webhook needs an endpoint and someone to maintain it. That is a cost on your side — small but real — so start with one scenario of clear value, for example "critical alarm → helpdesk ticket with the ALM number", and only then expand.
API: the same data you see on the dashboard — from code
A webhook carries events; the API gives on-demand access to the measurement data. This is the route for developers and analysts: the same readings you view on the charts can be pulled programmatically and used in your own tools. Typical uses are summaries in the corporate BI, integration with company-wide reporting, and custom analyses no off-the-shelf dashboard will anticipate.
A good selection heuristic: webhook when the moment matters; API when the dataset matters. Reacting to an alarm within a second of the event — webhook. A quarterly temperature summary of all locations in the corporate data warehouse — API.
MQTT and exports: a stream and files
The third route is MQTT — a data stream for systems that prefer subscribing to measurements as they arrive rather than polling an API. In practice it is the option for integrators and IT departments building their own processing: measurements flow into your infrastructure as they come in.
And sometimes no integration is needed at all. XLSX export (tabular or raw readings) and CSV take care of reports, ad-hoc analyses and "just send me the data in a spreadsheet", while PDF reports handle communication with the auditor and the board. Before you build an integration, check whether a file will do for the recipient: the cheapest interface is the one you never have to maintain.
Local output: BMS and SCADA straight from the gateway
A separate, often overlooked path runs below the cloud. Nextriv gateways can expose data to building and industrial automation locally — over BACnet/IP or Modbus TCP — so an existing BMS or SCADA sees the readings from wireless sensors as ordinary points, with no changes whatsoever to its own configuration.
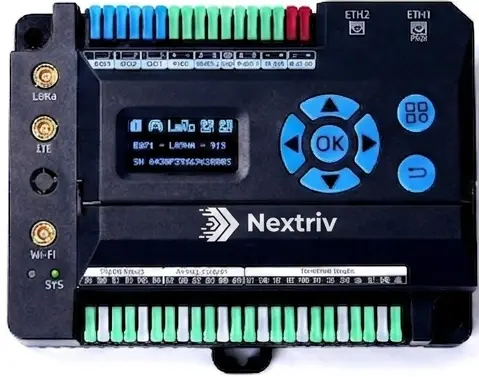
Nextriv Hub Edge goes furthest here: a gateway, protocol converter and I/O module in a single DIN-rail device. It reads RS485/Modbus, BACnet and KNX buses, has 19 physical inputs and outputs — including 4–20 mA and 0–10 V channels that bring third-party analogue sensors into the platform — and can execute logic locally, even without internet. For integration this means the cloud and the building automation are looking at the same numbers.
How to put it together in practice
Three scenarios we see most often:
- IT / DevOps team: critical alarms go by webhook into the ticketing system, warnings to the team channel, and the delivery audit in the platform confirms that every notification actually went out.
- Analytics department: the API feeds the corporate BI with measurement data alongside sales and production figures — hall temperature becomes one more column in the existing reports.
- Building maintenance: the gateway exposes readings to the BMS over BACnet/IP while the cloud watches thresholds and escalations in parallel — two worlds, one set of numbers.
You will find the full map of channels and data exit routes on the integrations page, and the costs of the individual plans in the pricing; webhook integrations and full data export are PRO plan features. The fastest route, though, is the hands-on one: book a demo and we will configure a test webhook to your address in a few minutes — from alarm threshold to a ticket in your system.