5 Years of Measurement History — Who Needs Trends That Long
5 years of measurement history: raw data instead of averages, seasonality, cooling degradation and SLA evidence — why a server room needs long trends.
Zespół Nextriv3 min read

A 5-year measurement history looks at first glance like overkill — who needs the temperature of a rack from before half the current team even worked here? And yet it's precisely the long horizon that separates monitoring that reports "what's happening" from monitoring that answers "where is this heading" and "what really happened". A year of history shows incidents; five years show trends, seasonality and degradation — the things planning is built on. Here are the situations where a multi-year history stops being a luxury.
A year of history is one winter and one summer
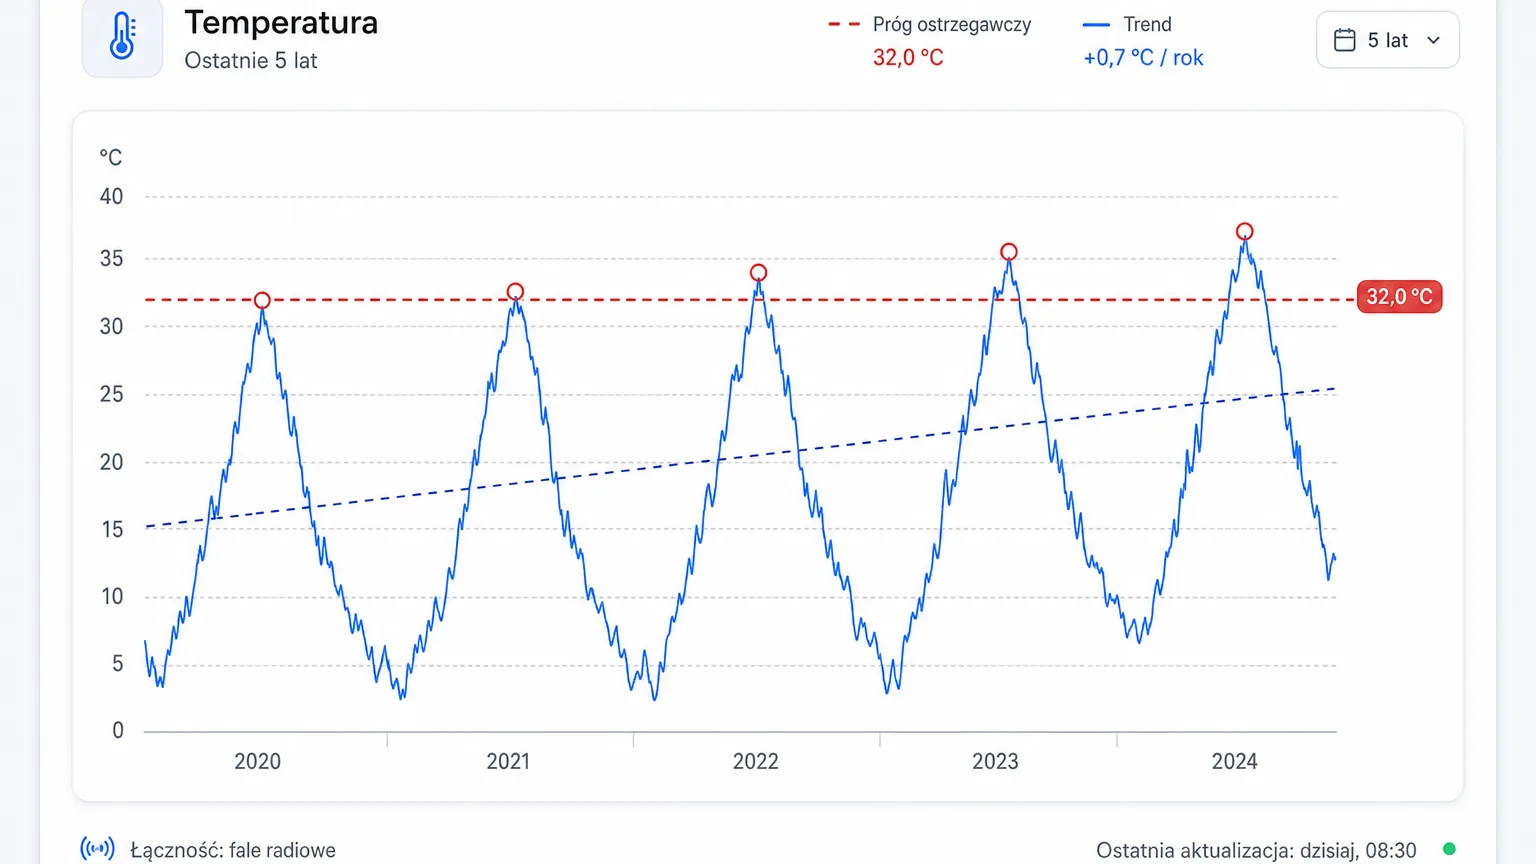
A single season proves nothing. A July temperature peak in a server room could be a weather anomaly, the result of added racks, or the beginning of a cooling problem — from a twelve-month perspective there's no way to tell. Only stacking several comparable periods separates weather variability from changes in the facility: if, under a similar summer, rack inlet temperatures rise year over year, it's not the climate — it's the facility.
The same goes for investment decisions. Expanding cooling capacity or adding a precision cooling unit is an expense planned in quarters, and the argument isn't one hot week but a multi-year trend of peaks, showing when the cooling headroom will genuinely run out.
5 years of measurement history in practice: four questions it answers
- Is the cooling degrading? Comparing the same months across consecutive years — under similar weather and load — reveals a drop in efficiency before it turns into an incident. That's data for a conversation with the service company, not a hunch.
- How much headroom is left? The trend of annual peaks pinpoints the moment the safety margin runs out. You plan the investment quarters ahead, not in a panic after the first overheating.
- What happened before the incident two years ago? A colocation client's claim, a dispute with an insurer, an analysis of recurring disk failures in one rack — all those conversations start with a question about conditions in a specific, distant week. The answer is either in the data, or nowhere.
- What backs up the audit? Audit and certification cycles can span years. The environmental conditions history for the full period between audits is a document — not the on-call team's recollections.
Raw measurements, not averages
The devil is in the word "raw". Many systems replace measurements with hourly averages after a few months — from a distance the chart looks similar, but a twenty-minute temperature spike after a fan failure vanishes from the average without a trace. In Nextriv, data older than 7 days is compressed (taking 80–95% less space) yet remains full, raw measurements for the entire retention period.
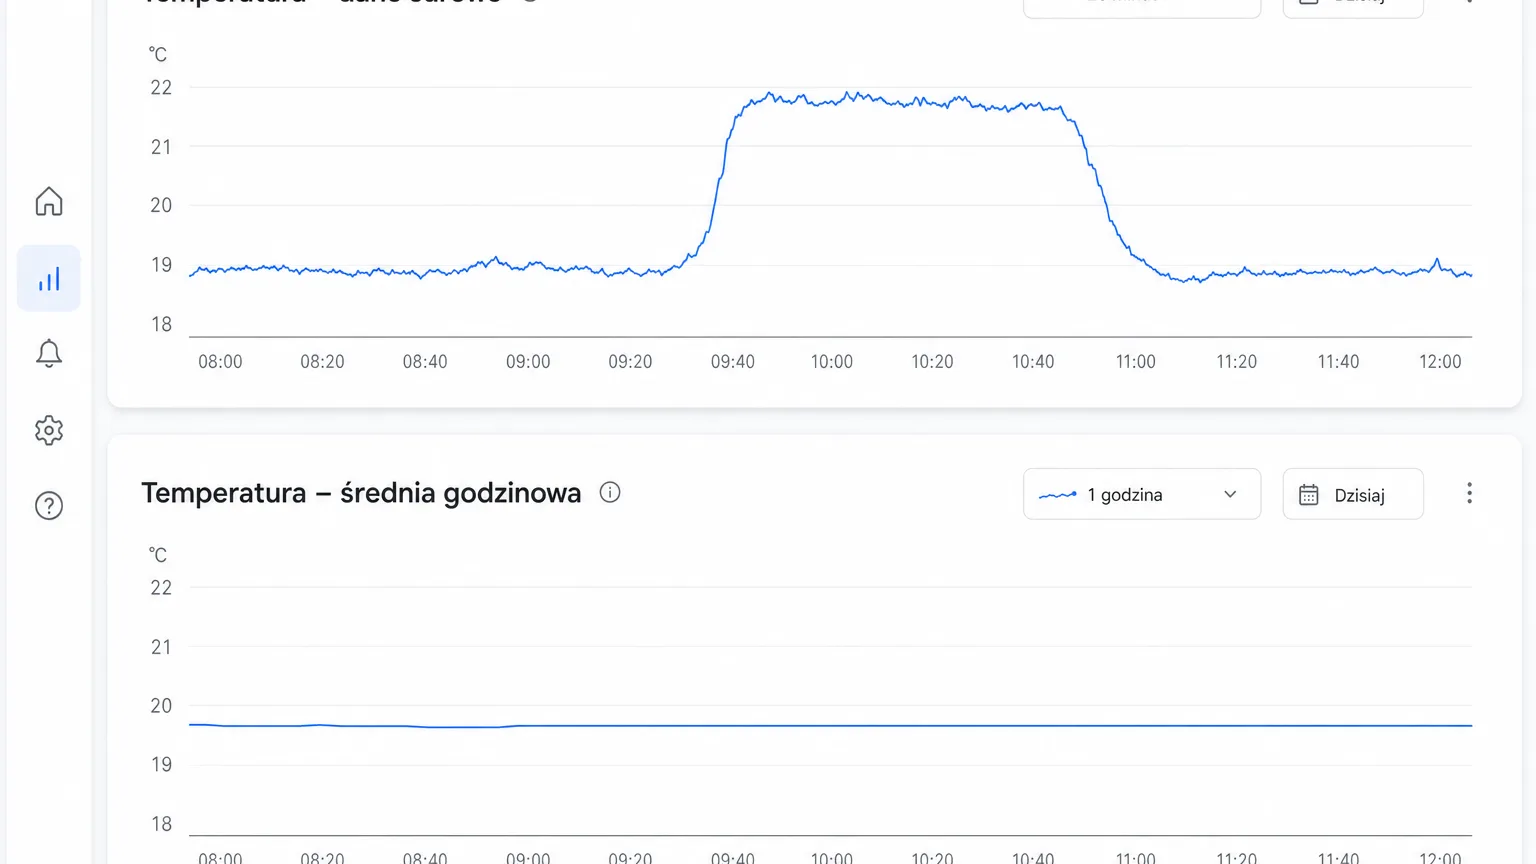
Long history doesn't slow down everyday work, either. Queries over long ranges are served by continuous aggregates (1 min / 5 min / 1 h / 1 d) with automatic resolution selection, and for series above 100,000 points the chart is downsampled by the LTTB algorithm, preserving the shape of the trace. In practice, a five-year chart opens as briskly as yesterday's — and when you need detail, zooming in reaches the full data.
A trend is worth as much as its credibility
A five-year history that could be quietly edited is worth little. That's why Nextriv builds an accountability layer around the measurement data, described in more detail on the security page: an audit trail and a separate security event log retained for 5 years (1,825 days), PDF reports with a SHA-256 signature, QR code and verification URL, and XLSX/CSV exports that ensure your data is never held hostage by the system. How long retention holds up during an inspection in regulated industries is covered separately in our article on data retention for audits.
Hardware for a five-year horizon
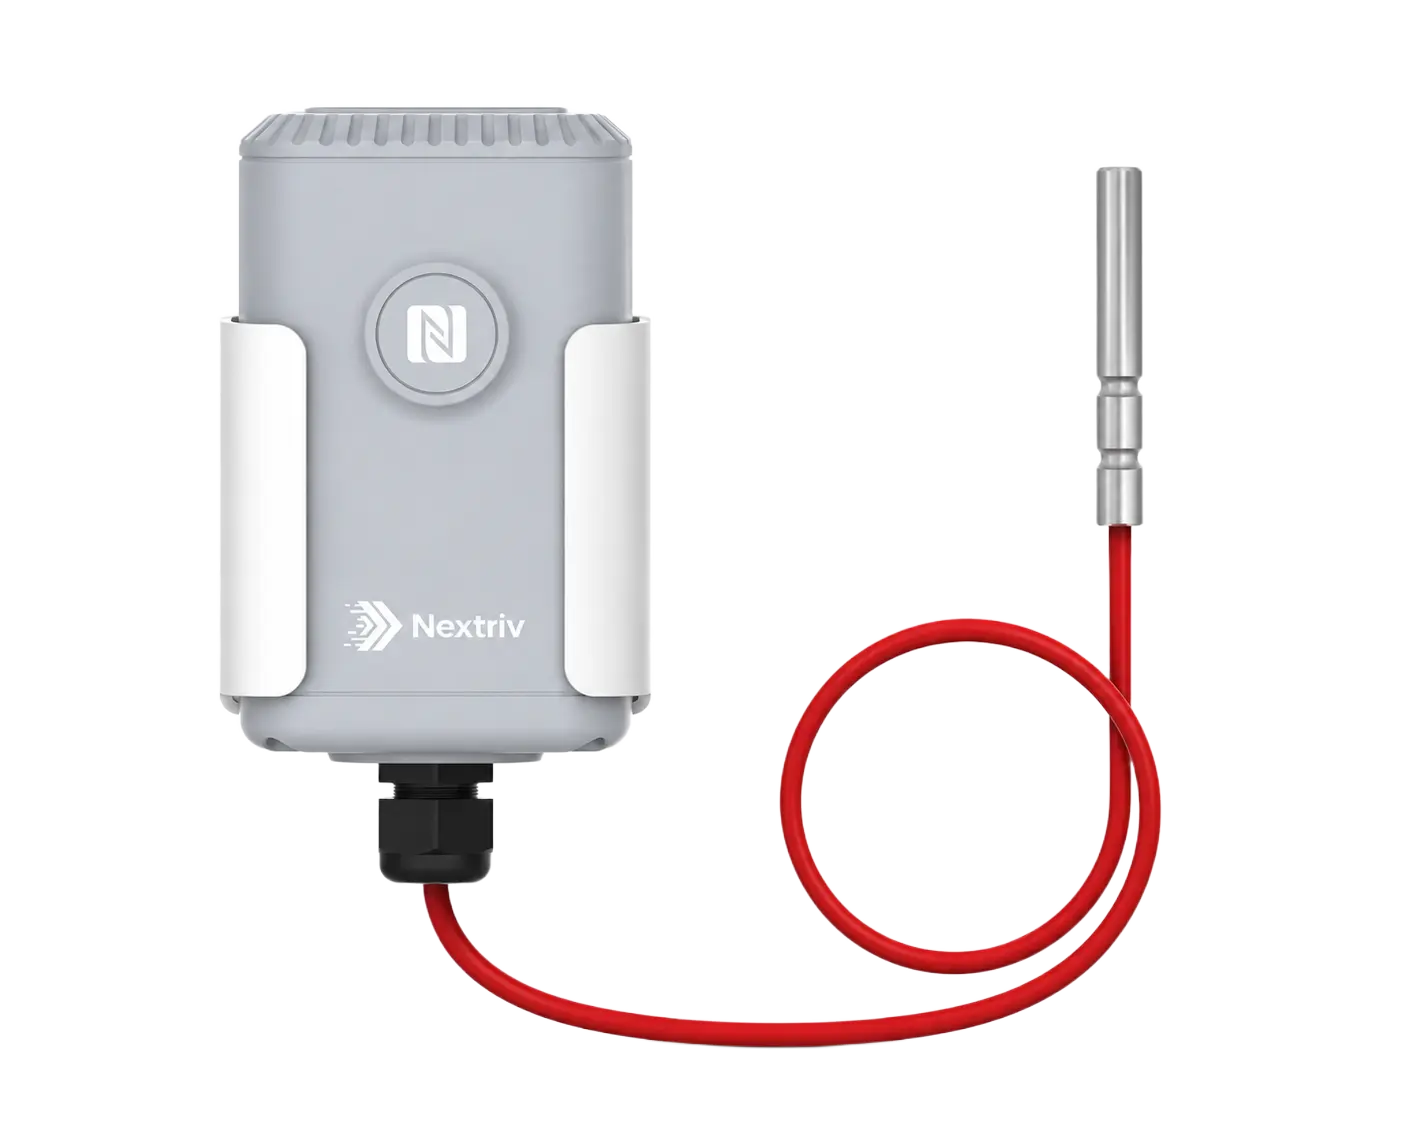
A multi-year trend demands hardware that leaves no gaps. The industrial Nextriv Probe PT100 runs up to 10 years on a single battery — one battery cycle covers the entire retention period with room to spare — and a local buffer of around 1,000 measurements with automatic retransmission patches connectivity outages before they become holes in the history. The platform also keeps a calibration register with reminders of due dates: with data that's years old, the question "what was this measured with, and when was it calibrated" always comes up — better to have the answer in the system, not in a binder.
When a year really is enough
For the record — honestly: not everyone needs five years. If you monitor a single rack with no SLA obligations, undergo no audits and plan no expansion, the 365 days of raw history in the free plan settles it — you'll see a full seasonal cycle and every incident from the past year. The long horizon starts paying for itself in three situations: when you answer to a client or auditor for conditions from years back, when you plan cooling investments based on a trend, and when the facility outlives the team's institutional memory. In a commercial server room, all three usually apply at once.
From 365 to 1,825 days
Nextriv's free plan retains raw measurements for 365 days — enough to get through your first full season and see the value of trends for yourself. The full 1,825 days (5 years), together with the audit trail and signed reports, come with the paid plan: 99 PLN net per 30 days or 990 PLN net per year (excl. VAT).
How a multi-year history works with the rest of server room monitoring — hot spots, leaks under the raised floor, power — is described in our data center solution. Plan details are in the pricing section, and if you'd rather see a five-year chart live — book a demo.


