
ISO 14644 — Cleanroom Monitoring Between Classification Tests
ISO 14644 cleanroom monitoring between classifications: continuous particle, temperature and humidity trends with alerts — without replacing accredited tests.
Zespół Nextriv4 min read

ISO 14644 and cleanroom monitoring tend to get conflated into a single ritual: an accredited laboratory arrives, sets up particle counters, issues a classification report — and the cleanroom "has its paper" for the next period. Except that a year usually passes between one test and the next, and a filter can lose its seal on any given Tuesday. The standard actually says it outright: classification and routine monitoring are two different things, and a monitoring plan between classification tests is a requirement in its own right, not good practice for the keen. This article sorts out what can be continuously supervised in that window between classifications — and what continuous monitoring honestly cannot replace.
Classification vs monitoring — two different parts of ISO 14644
Part one of the standard (ISO 14644-1) defines air cleanliness classes — from ISO 1 to ISO 9 — based on the maximum permitted particle counts per cubic meter of air for specified particle sizes. The class is assigned on the basis of particle counter measurements at a prescribed number of points, following a strict procedure. It's a periodic test: performed when the room is qualified and repeated at intervals derived from the standard and a risk assessment.
Part two (ISO 14644-2) answers the question of what happens in between: it requires a risk-based monitoring plan demonstrating that the room maintains its declared parameters during normal operation. The logic is simple — the classification certificate describes the state on the day of the test, while production runs all year. If filter degradation, a leak or bad personnel habits are only caught by the next classification, it means the process spent many months running under conditions nobody knew about.
Honestly: what continuous monitoring won't replace
Before the possibilities — the line that must not be glossed over. Classification is performed with particle counters, which count individual particles in size channels and report the result in particles per cubic meter — because that's how the ISO classes are defined. Monitoring-class particulate sensors measure something else: the mass concentration of PM2.5 and PM10 in micrograms per cubic meter. It's different physics and a different unit — a PM sensor reading cannot be converted into an ISO class, and no honest vendor should promise that it can.
Continuous trend monitoring therefore replaces neither the classification tests nor the standard-mandated measurements taken with calibrated counting instruments. What it does replace is something else: the blindness between those tests. A stable, low PM trend is a signal that nothing has changed; a clear spike, or a creeping rise week after week, is a reason to check filters, seals and procedures — long before the problem would surface at reclassification.

What to supervise between classification tests
In practice, the monitoring plan between classifications rests on a handful of parameters that together describe the room's condition:
- PM2.5/PM10 particulate trend. Indicative, not classificatory — but it's the first thing that will reveal a lost seal, a worn filter or contamination carried in from outside. What counts is not any single reading but the deviation from a baseline established in the period right after classification, when the room was demonstrably in shape.
- Temperature and humidity. Thermal and humidity stability is a precondition for the repeatability of many processes and for comfort in protective clothing; measurement at ±0.2 °C and ±2% RH also catches HVAC setpoint drift.
- Correlation with human activity. The main particle source in a cleanroom is people. A motion sensor set against the particulate trend shows whether increases coincide with personnel presence (normal) or occur in an empty room (alarming — something is emitting or leaking).
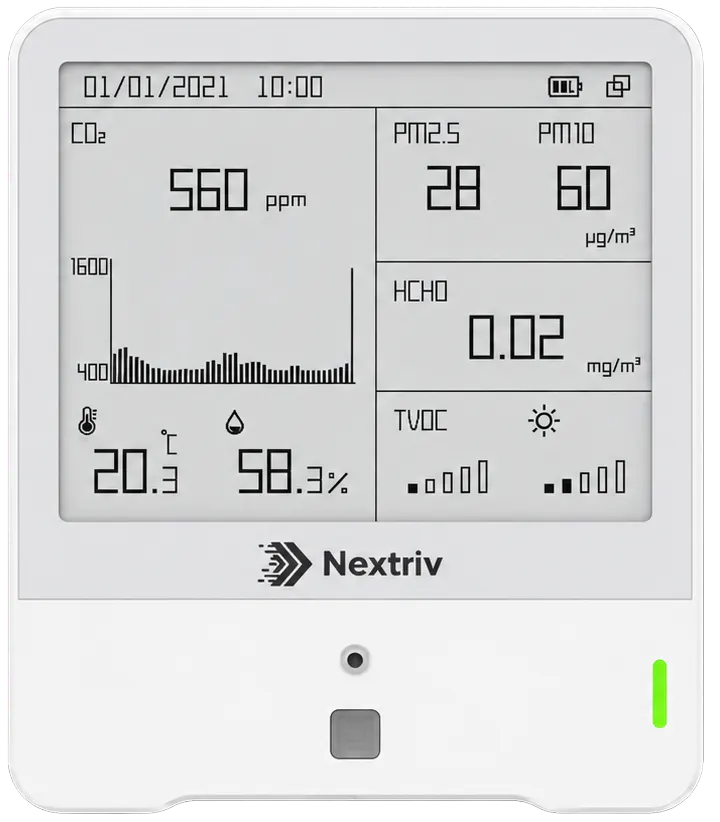
One device can collect all of these parameters. The Nextriv Sense IAQ Pro measures nine quantities at once — including PM2.5/PM10 particulates, temperature, humidity, CO₂ and motion — and its USB-C power and always-on radio listening mode mean the device doesn't economize on measurement frequency and responds to remote commands immediately. A non-erasable local history of 18,000 records with retransmission after a connectivity outage keeps the oversight data free of gaps — and at an audit, a gap in the data is a problem scarcely smaller than an exceedance.
Thresholds, alerts and a response before the process suffers
Industry oversight practice works with two levels: an alert level, signaling a departure from the normal state, and an action level, which triggers a defined procedure. That logic maps directly onto the four thresholds per metric in the Nextriv platform: warning thresholds play the role of alert levels, critical ones — action levels, each with its own event severity. A crossing generates an event with a code, a status and room for a comment — from "filter replaced, observing" to "process halted" — so the response history builds itself, as a by-product of the work.
Notifications arrive on the channel suited to the role: email and SMS for maintenance, MS Teams for quality, an in-app audible alarm at the supervision station. An escalation policy makes sure an unacknowledged alert moves up a level, and a sensor that falls silent for twice its reporting interval gets flagged offline — the system distinguishes "it's clean" from "we have no data".

Documentation that holds up at an audit
Monitoring between classifications has value only if it leaves a trace. Three elements complete the documentation:
- Reports. Recurring PDF reports with statistics, percentiles and a threshold compliance section, optionally signed with a SHA-256 checksum, QR code and verification URL — the auditor can independently confirm that nobody touched up the chart after the fact.
- History and retention. Raw measurements available up to 5 years back, plus XLSX/CSV exports for your own analyses — how to match retention periods to audit requirements is covered in our article on measurement data retention.
- Instrument oversight. An indicative sensor needs metrological supervision too: the platform stores calibration dates, due dates and certificates, with reminders keeping the calendar — we expand on these principles in our guide to sensor calibration.
Trend oversight built this way — indicative sensors day to day, accredited classification measurements on schedule, documentation tying one to the other — is the pattern we describe in more depth in our solution for manufacturing and industry.
Want to see the particulate trend with alert/action thresholds and a signed report on a live system? Book a short demo — or start with the pricing and a single measurement point in your most critical room.


