TVOC, PM2.5 and PM10 — what air quality sensors really measure
TVOC, PM2.5 and PM10 explained: what air quality sensors really measure, how to read the TVOC index and µg/m³ dust values, and which alert thresholds to set.
Zespół Nextriv5 min read

TVOC, PM2.5 and PM10 are three abbreviations found on the datasheet of every decent air quality sensor — and three parameters surrounded by more misunderstanding than any others. CO₂ is intuitive: people breathe, the concentration rises. But what exactly does a laser particulate sensor "see"? Why is TVOC sometimes reported in micrograms per cubic metre and sometimes as an index from 1 to 5? And which of these numbers should trigger an alarm? Below we take these parameters apart — no marketing shorthand, just values you can translate directly into thresholds in a monitoring platform.
PM2.5 and PM10 — the dust you cannot see
Particulate matter (hence "PM") covers all the solid particles and droplets suspended in the air. The number in the name is the upper bound of the diameter in micrometres: PM10 covers particles up to 10 µm, PM2.5 — up to 2.5 µm. For scale: a human hair is about 50–70 µm across, so we are talking about particles dozens of times thinner. That size difference matters for health: the larger PM10 particles are stopped mostly in the upper airways, while PM2.5 reaches deep into the alveoli — and is considered the most dangerous fraction.
Where does the dust in a building come from? Partly from outside — traffic and heating-season smog comes in with every door opening and through gaps in the envelope, and the heating season shows up on indoor charts almost as clearly as on city monitoring stations. Partly from inside: printers and office equipment, dust stirred up by people moving around, renovation work, and in food service — frying and baking.
The reference point for interpretation comes from the World Health Organization's 2021 guidelines: a 24-hour value of 15 µg/m³ for PM2.5 and 45 µg/m³ for PM10. These are the recommended values for the air we breathe — indoors as well. If a sensor inside an office regularly shows more, either the supply air filtration is not keeping up or the dust source is indoors.

How are they measured? Professional-grade sensors use the laser scattering method: a light beam passes through an air sample and an optical assembly counts and classifies the particles by how they scatter the light. The measuring path in Nextriv stations covers 0–1000 µg/m³ with ±10 µg/m³ accuracy in the 0–100 µg/m³ band — that is, most accurate exactly where the health questions are decided. Worth knowing: this is the most power-hungry element of the device — with dense particulate sampling, USB-C power is recommended over battery operation.
TVOC — one indicator for hundreds of compounds
VOC (volatile organic compounds) are organic vapours: solvents, hydrocarbons, aldehydes and dozens of other substances evaporating from furniture, adhesives, carpets, paints, cleaning products and cosmetics. The "T" stands for "total" — the sensor does not distinguish individual compounds; it measures their combined presence.
And here is the first important point: a typical TVOC sensor is a semiconductor (MOX) device that responds to organic compounds oxidising on a heated metal-oxide layer. Such a measurement is inherently relative — which is why the result is most often reported as an air quality index on a 1.00–5.00 scale, where values around 1 mean clean air and rising values mean a growing load of organic compounds relative to the sensor's recent surroundings. Higher-end stations can additionally express the result as a concentration in the 0–2000 µg/m³ range.
A practical rule follows from this characteristic: with TVOC the trend matters more than the absolute value. A spike in the index after weekend cleaning, after new chipboard furniture arrives or after a renovation one floor up shows on the chart immediately — and it is precisely these changes that should trigger a response, not comparing a single reading against a table from the internet.
Formaldehyde (HCHO) is a category of its own — the best-researched single compound in the VOC family, emitted for months by freshly finished interiors. Where it has to be measured precisely and separately, a TVOC index is not enough: you need a dedicated electrochemical cell, such as the optional HCHO channel in the Nextriv Sense IAQ Pro station (0–1.25 mg/m³ range, 0.01 mg/m³ resolution).
TVOC, PM2.5 and PM10 in practice: how to read these numbers day to day
Three rules that bring order to interpretation:
- Read particulates in absolute terms, TVOC in relative terms. For PM2.5/PM10 there are reference values in µg/m³ (like the WHO daily guidelines), so a reading can be assessed directly. A TVOC index is assessed by its deviation from the normal level of the given room.
- Look for correlations with events. A PM peak at 7:30 and 16:00 is usually the entrance door and the traffic rush; a TVOC peak on Monday at 6:00 — the cleaning crew's chemicals; elevated PM10 at a workstation — a printer or carpet dust. A chart spanning a few days says more than an auditor's single reading.
- Look at the parameters together. High TVOC with low CO₂ points to a chemical source, not the presence of people. Rising particulates with the windows open in smog season is a signal that airing "by gut feeling" can be worse than ventilation with filtration.

What to measure with: nine parameters from a single point
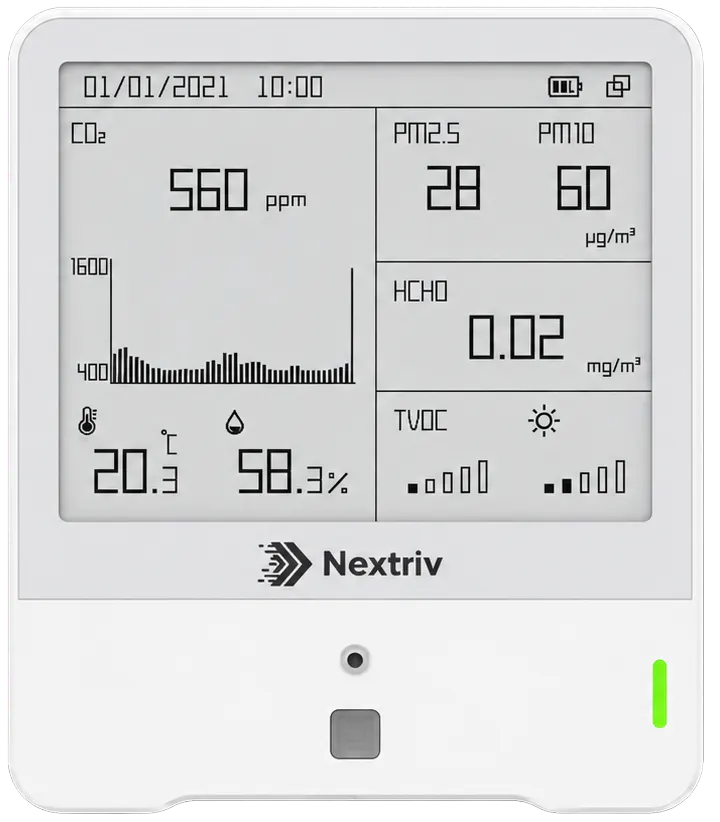
Particulates and volatile compounds are not usually measured with separate devices — it makes more sense to choose a multi-parameter station that puts them on a single chart next to CO₂, temperature and humidity. The flagship Nextriv station measures nine parameters at once: temperature, humidity, CO₂ (photoacoustic), TVOC, PM2.5/PM10 particulates, pressure, light and motion, plus a ninth channel — your choice of formaldehyde or ozone. It also carries a conformity mark for the WELL healthy-building certification programme, so its data is credible material in building certification processes. The large e-ink screen shows the state of the air on the spot — to everyone walking past.
The data travels to the platform over a long-range radio link (~2 km in the city, ~15 km in open terrain), with no signal cabling — installation is tape or screws, and configuration means holding a smartphone to the device over NFC.
From a reading to an alarm
Measurement alone changes nothing — the response makes the difference. In the Nextriv platform each metric gets its own set of up to four thresholds (warning and critical, lower and upper). A sensible start: a PM2.5 warning threshold around the WHO daily guideline, a critical one distinctly higher; for TVOC — a threshold on the deviation from the room's typical level, corrected after a few weeks of data. Notifications reach the team where it works: email, SMS, web push, Microsoft Teams, Discord or an audible alarm in the app, and every event carries a readable code and status, so nothing gets lost in inboxes.
What such supervision looks like across an entire property — from the lobby to the office floors, together with reports for the property manager and tenants — is described in the solution for buildings and offices.
Where to start
The simplest scenario: one multi-parameter station in the busiest zone and a month of data collection. After four weeks the charts themselves will show whether the problem is outdoor smog, cleaning chemicals or carpet dust — and whether it is worth adding measurement points. The free plan includes 10 sensors, a gateway and a full year of measurement history, so a pilot needs no software budget — we wrote more about that when Nextriv launched.
Check the pricing or book a short demo — we will show on live data how TVOC and particulates behave in a real building and how to set thresholds that alert you to a problem, not to noise.


