Greenhouse CO₂ — managing supplemental lighting and venting for photosynthesis
Greenhouse CO2 sets the pace of photosynthesis. How to measure it with an NDIR sensor and decide when to light and when to vent without losing yield or heat.
Zespół Nextriv4 min read

CO₂ in a greenhouse is one of the three raw materials of photosynthesis — alongside light and water — and the only one that can "run out" in the middle of the day. In a tightly sealed facility with a lush crop, plants draw down carbon dioxide faster than it can get in from outside. The concentration drops, photosynthesis slows, and the grow lights keep drawing power — except the plant no longer has anything to build yield from. This article shows how to measure CO₂ under cover and how to base lighting and venting decisions on that data.
Photosynthesis consumes CO₂ faster than you supply it
Outdoor air contains roughly 420 ppm of carbon dioxide, and that is the natural reference point. In a closed greenhouse the balance looks different: on a sunny day — or under full supplemental lighting — the crop can pull the concentration well below the outdoor level before anyone notices. In winter the problem sharpens: venting doesn't pay because heat escapes, so the facility stays sealed and the plants spend many hours working on starvation rations.
That costs you twice. Once through slower growth and a lower yield. And again on the energy bill: running lights during a CO₂ deficit means paying for light the plant cannot use, because it lacks the other ingredient of the reaction.
Greenhouse CO₂: which levels make sense
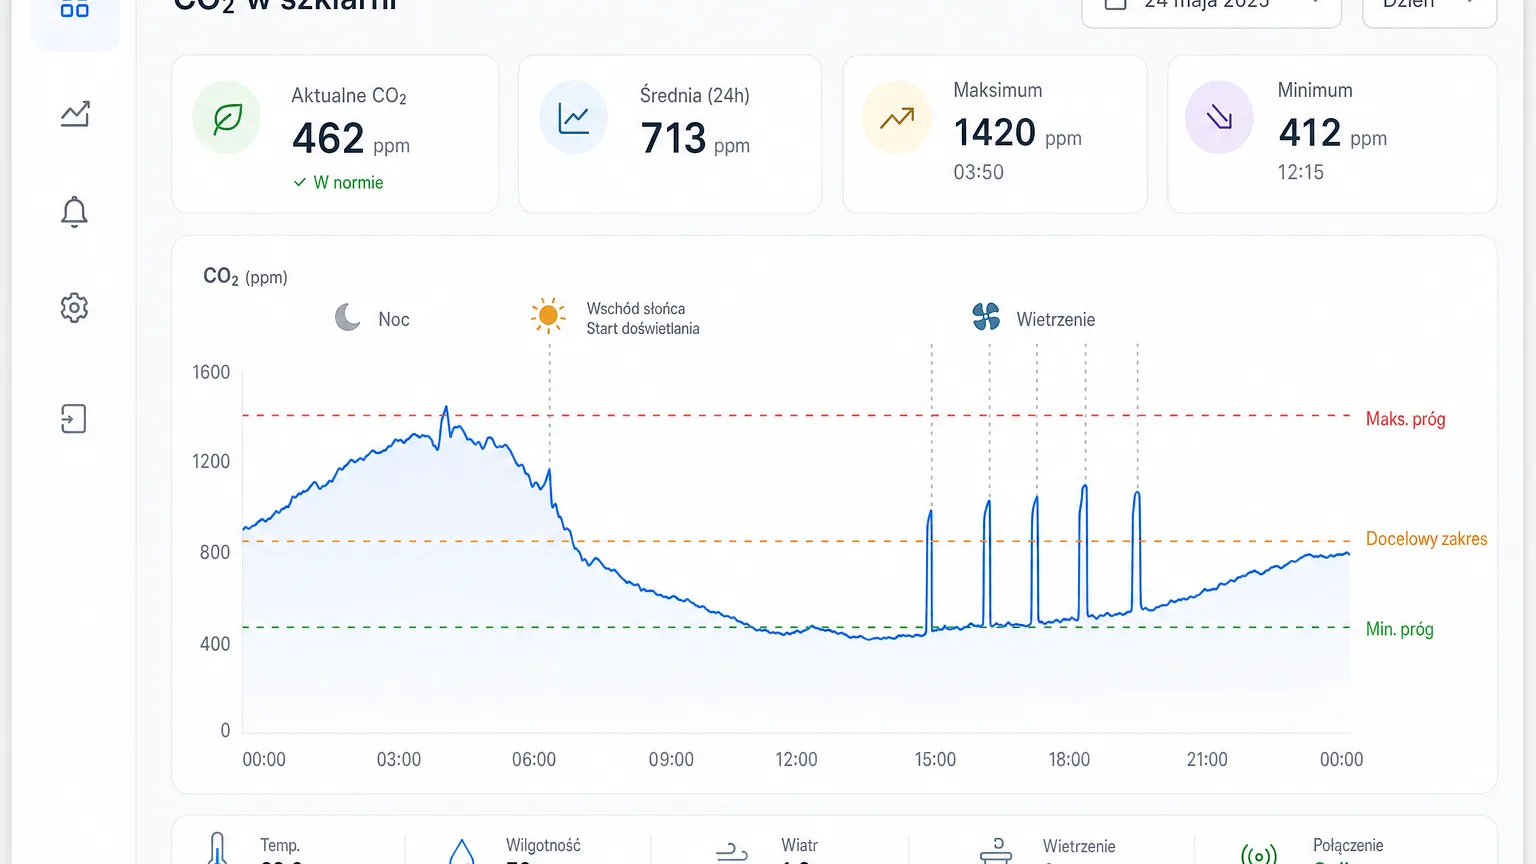
Three situations worth telling apart on the chart:
- Below the outdoor level (approx. 420 ppm) — deficit. The crop is consuming CO₂ faster than the facility replenishes it; photosynthesis is limited by lack of raw material, not by light.
- Around atmospheric background — a neutral state, typical of a facility with good air exchange.
- Above background — the enrichment zone. In greenhouse production the concentration is raised deliberately (CO₂ dosing), because with good light the plants can take advantage of it; an upper alarm threshold then watches whether the dosing system is feeding too much.
There is no single "right" number for every crop and every technology — which is exactly why measurement matters more than a lookup table. Thresholds are set for your own facility: the lower one where the deficit against background begins, the upper one where intended enrichment ends.
Measurement that survives under cover
A greenhouse is not an office: humidity reaches saturation, temperature swings between night and noon, and there's fogging, spraying and washing on top. An office-grade sensor doesn't last long here. You need NDIR measurement (non-dispersive infrared) — stable over the long term and calibratable — in an enclosure that can take water and dust.
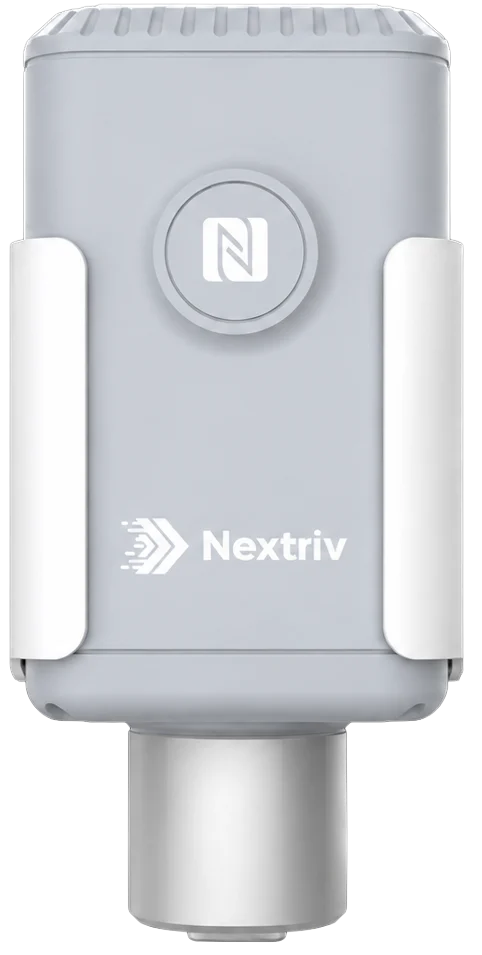
Nextriv Sense CO₂ Industrial measures CO₂ with NDIR across 400–5000 ppm at ±(30 ppm + 3% of reading) accuracy — comfortably covering both the deficit and the enrichment zone. The IP65 enclosure handles moisture and washdowns, and the operating range from −30 °C lets you measure in unheated tunnels and produce stores as well. The same device gives you three more measurements: temperature (±0.3 °C), humidity and barometric pressure — a complete climate dataset from a single point, on a battery that lasts up to 10 years.
Record continuity is handled in hardware too: the sensor buffers 1000 entries locally and resends them after any connectivity gap, and you configure it via NFC without opening the enclosure. In large facilities it pays to hang two measurement points — e.g. at the start and end of a bay — because the CO₂ distribution with a curtain or heater running tends to be anything but uniform.
Supplemental lighting and CO₂ have to play together
Whether lighting makes sense depends directly on CO₂ availability: the more light, the faster the crop consumes carbon dioxide. That is why, alongside concentration, it is worth measuring the actual light intensity at the plants — a job for Nextriv Sense Lux Pro, an outdoor 0–100,000 lx sensor with a probe on a 3-metre cable that you place exactly at crop height.
Both curves on one dashboard answer the question no schedule ever asks: during lighting hours, does the plant have anything to work with? If the light chart climbs while CO₂ dives below background — you are burning electricity with no photosynthesis to show for it. An alert rule with a lower CO₂ threshold catches that moment automatically, and the webhooks integration passes the event on to the facility's automation, e.g. the dosing system.
Venting: a trade-off you only see in the data
Venting fixes one thing and breaks another. Open vents lower humidity — and with it fungal disease pressure — and top CO₂ back up to background, but at the same time they dump heat, and where dosing is used, expensively enriched carbon dioxide too. The "vent or not" decision is always a calculation across four variables at once: CO₂, humidity, indoor temperature and outdoor conditions.
That is why measuring four parameters with one sensor carries practical weight here: you see the full context of every decision in one place. In the Nextriv platform every metric gets its own thresholds (up to four per metric: warning and critical), and notifications arrive on a channel you actually read — email, SMS, web push, Teams, Discord or an in-app siren. The executive decision stays with your climate automation — Nextriv supplies the data and events that automation can rely on.
From pilot to full deployment
The simplest start is a single CO₂ sensor hung at crop height, away from the vent and the air supply, plus lower and upper thresholds tuned to your production. After two weeks the daily chart will show where the yield is escaping: in the morning dip after lights-on, or during the tightly sealed hours. The sensors connect over radio at distances measured in kilometres, so the same gateway will cover further tunnels and the produce store — what a full deployment looks like is described on the solution page for agriculture and greenhouses.
The FREE plan covers 10 sensors and a year of measurement history — enough for a solid pilot. Take a look at the pricing or book a demo: we will show a CO₂-and-light chart from a real facility and an alert that catches the deficit before your yield does.


