Virtual sensors — averages, sums and derived metrics from real measurements
Virtual sensors compute averages, sums, corrections and ratios straight from real measurements. See how avg, sum, offset and ratio work — no new hardware.
Zespół Nextriv4 min read

Virtual sensors answer the question every monitoring user asks sooner or later: "I have five sensors in the cold room, but what actually is the temperature of the cold room?". A physical sensor measures a point — half a metre from the evaporator, by the door, deep among the racking — while decisions are made on zones, totals and indicators. A virtual sensor computes such a derived metric from real measurements and hands it to the platform as if another device had measured it: no new hardware, no battery, no drilling. In Nextriv four transformations are available — average, sum, correction and ratio. Below, how each of them works and where they make the biggest difference.
Virtual sensors, or measurements no device takes
The definition is short: a virtual sensor is a metric computed in software from the readings of existing physical sensors. You point at the sources and the type of transformation, and the platform creates a new "measurement" you work with exactly like any other: you view it on the dashboard, follow its trend and put it into reports.
The most important consequence is economic and practical at once. A new metric usually means buying, mounting and maintaining another device — a virtual sensor comes to life in a minute from data already flowing into the system. It is also the only "sensor" that will never report a weak battery or drop out of range.
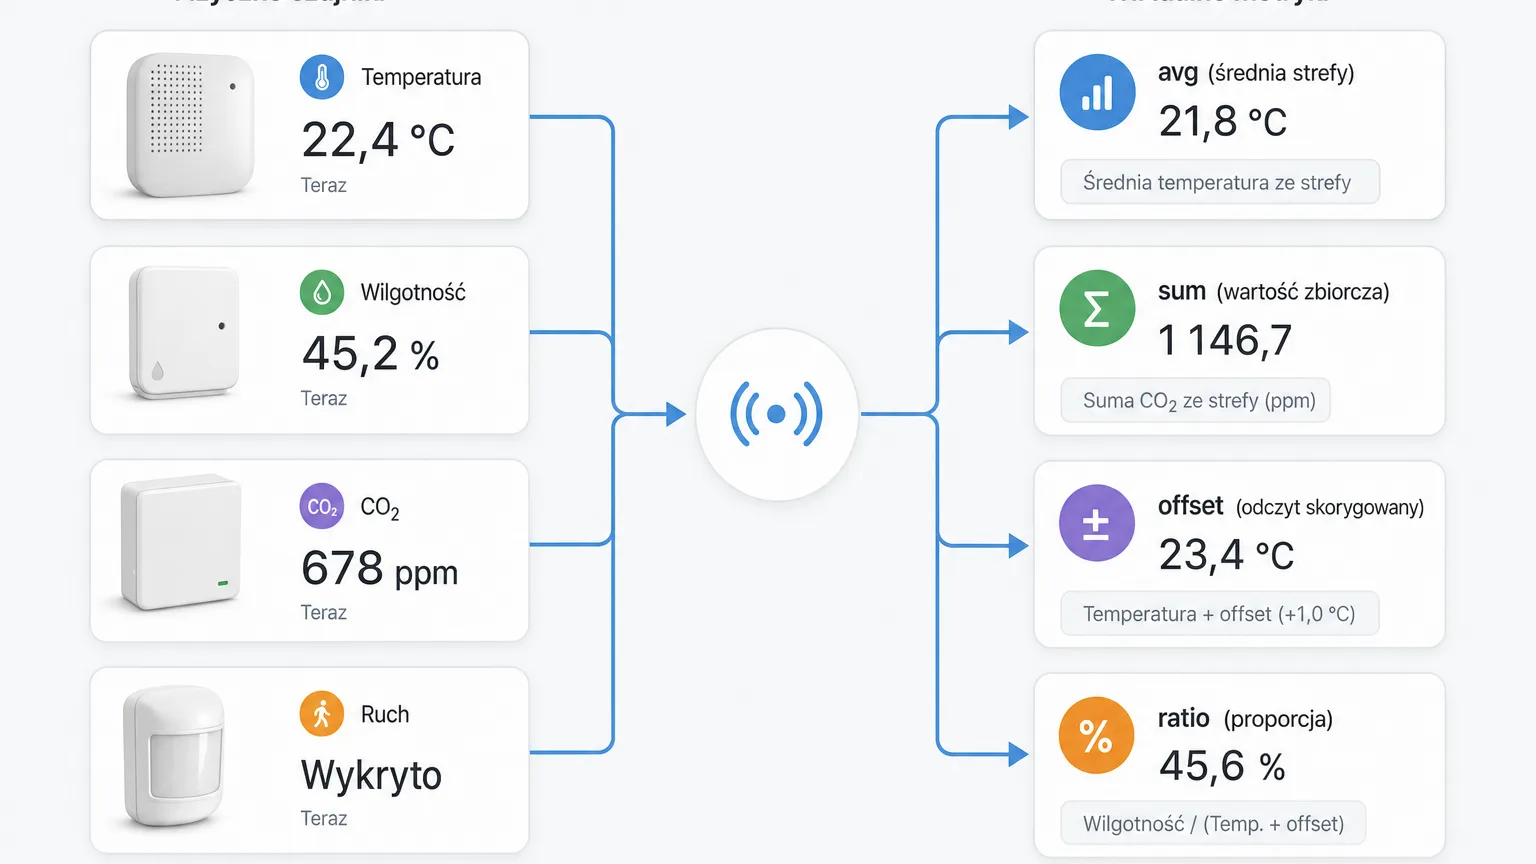
Four transformations: avg, sum, offset and ratio
Average (avg). The classic and the most common case: several measurement points in one zone, and what interests you is the state of the zone as a whole. The average cold room temperature from three sensors placed by the door, in the middle and in the farthest corner says more about the chamber than any single point. How to place those points sensibly is covered in our guide to cold zone monitoring.
Sum (sum). Values from multiple sensors added into one aggregate metric — wherever the combined result matters, not the individual components. Instead of paging through several separate charts, you watch one number that describes the whole.
Correction (offset). Sometimes a sensor consistently reads high or low by a constant amount — because it hangs closer to a heat source than it should, or a comparison against a reference during calibration revealed a constant deviation. Offset corrects such a measurement by a set value without touching the source data: the original reading stays, and a corrected metric appears alongside it.
Ratio (ratio). The proportion of two metrics computed as a separate measurement. Where the relationship between two quantities is what matters — rather than each of them on its own — ratio turns two curves into one readable indicator you can track over time like a regular reading.
Why average when you can watch the points
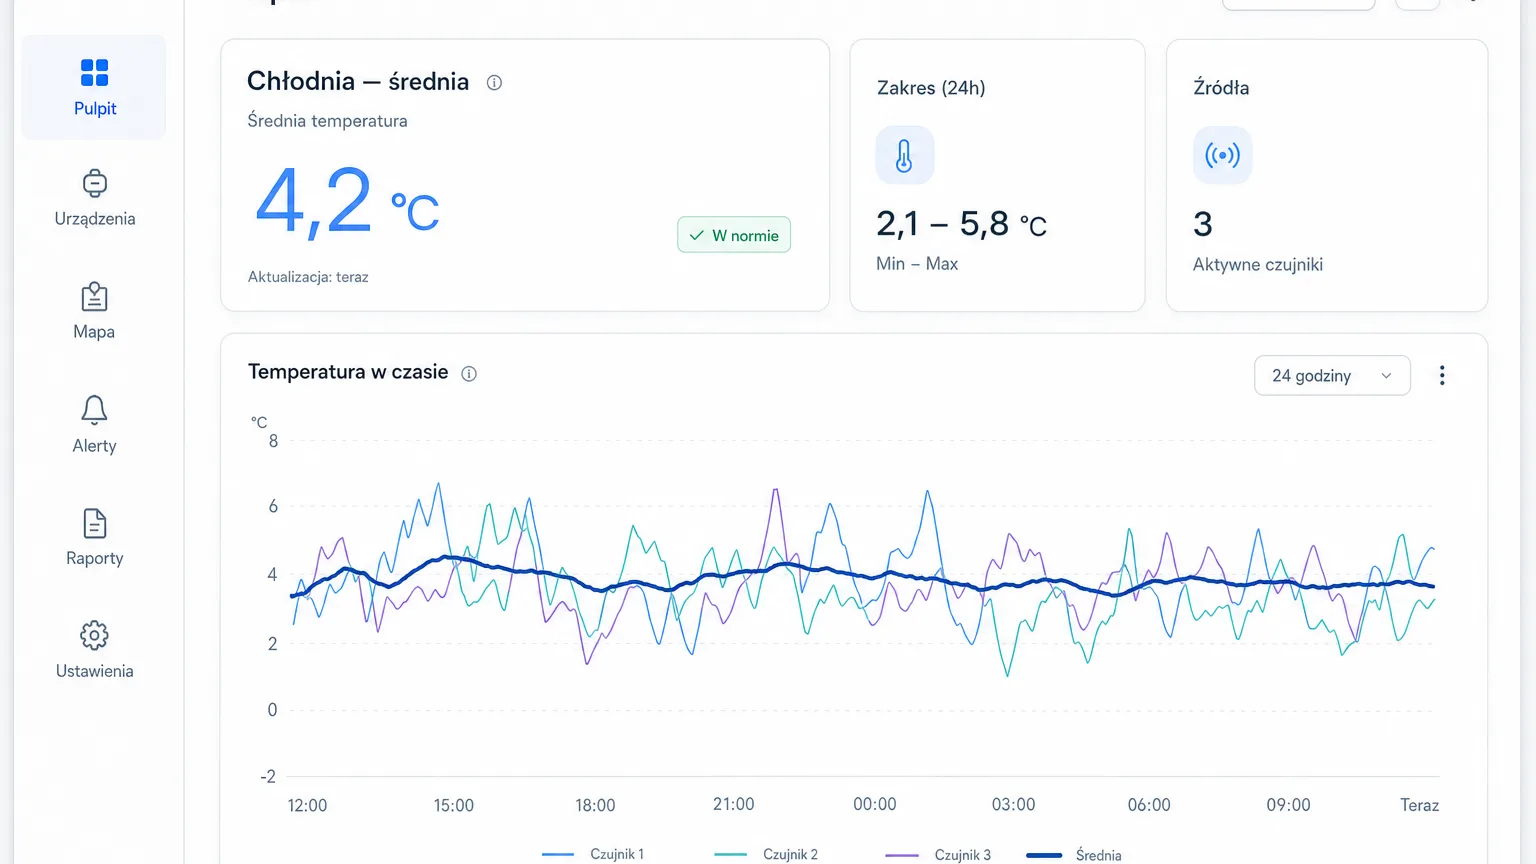
A single measurement point can be twitchy. The sensor by the cold room door jumps with every opening, the sensor under the office ceiling reacts to sun slipping past the blinds — and every such local anomaly looks on the chart like a problem with the whole room. The zone average smooths that noise away: it shows the state the goods on the racking or the people in the room actually experience, not the microclimate of one nook.
An office is a good example. CO₂ in a meeting room after an hour-long meeting and in an empty open-plan space differ dramatically — a per-floor average tells the facility manager whether ventilation is keeping up with the building as a whole, while the points show where to intervene first. More on the measurements themselves in our article on air quality in the office.
There is a second order of benefit too: communication. "Chamber K2 average temperature: 4.1 °C" is a sentence the board, the auditor and a first-day employee all understand. A list of eight measurement points with eight values — not necessarily.
A virtual measurement behaves like a real one
The whole strength of this mechanism is that the platform doesn't treat derived metrics as second-class. A virtual sensor appears on dashboards next to physical ones — nearly 20 widget types are available, from a simple value tile to multi-series charts — its history is stored and available in trend analysis, and the computed metric flows into PDF reports and exports just like raw readings. A full overview of these capabilities is on the platform features page.
The foundation, though, remains reliable source measurements — no average will be better than the sensors it is built from. In typical zone deployments the base is Nextriv Sense Essential: a temperature and humidity sensor with ±0.2 °C accuracy in a sealed IP67 enclosure, equally at home in a cold room and on an outdoor dock. A few such points in one zone are ready material for a virtual average of the whole chamber.

Where to start
The recipe is simple. First make sure you have at least two or three physical measurement points in the zone you are really asking about — they will decide the quality of every derived metric. Then start with a single average for the most important zone and check for a week whether it tells the same story as your intuition. Only then add further transformations: a sum where the total matters, an offset where you know the constant deviation, a ratio where the proportion is what counts.
On the formal side: virtual sensors are part of the platform's paid plan — 99 PLN net / 30 days or 990 PLN net / year, and the full plan comparison is in the pricing. If you would rather see the mechanism in action first, book a demo — we'll configure a virtual average for your scenario on a live system and show how it looks on the dashboard and in a report.


