What good office air quality means and how to measure it
Office air quality can be measured: CO₂, temperature, humidity, TVOC and particulates. We explain which parameters matter and how to monitor them.
Zespół Nextriv4 min read

Office air quality is not a slogan from an ESG report but a measurable set of parameters that decides whether the team is still thinking straight after an hour-long meeting. The trouble is that most offices judge their air solely by complaints: "it's stuffy", "it's cold", "the AC is blowing". Disputes are settled by whoever complains the loudest — because nobody has data. Yet turning impressions into numbers comes down to a handful of parameters and one sensor per zone.
What makes up office air quality
IAQ (indoor air quality) covers several physical quantities. Each tells you something different, and each goes wrong for a different reason.
Carbon dioxide (CO₂)
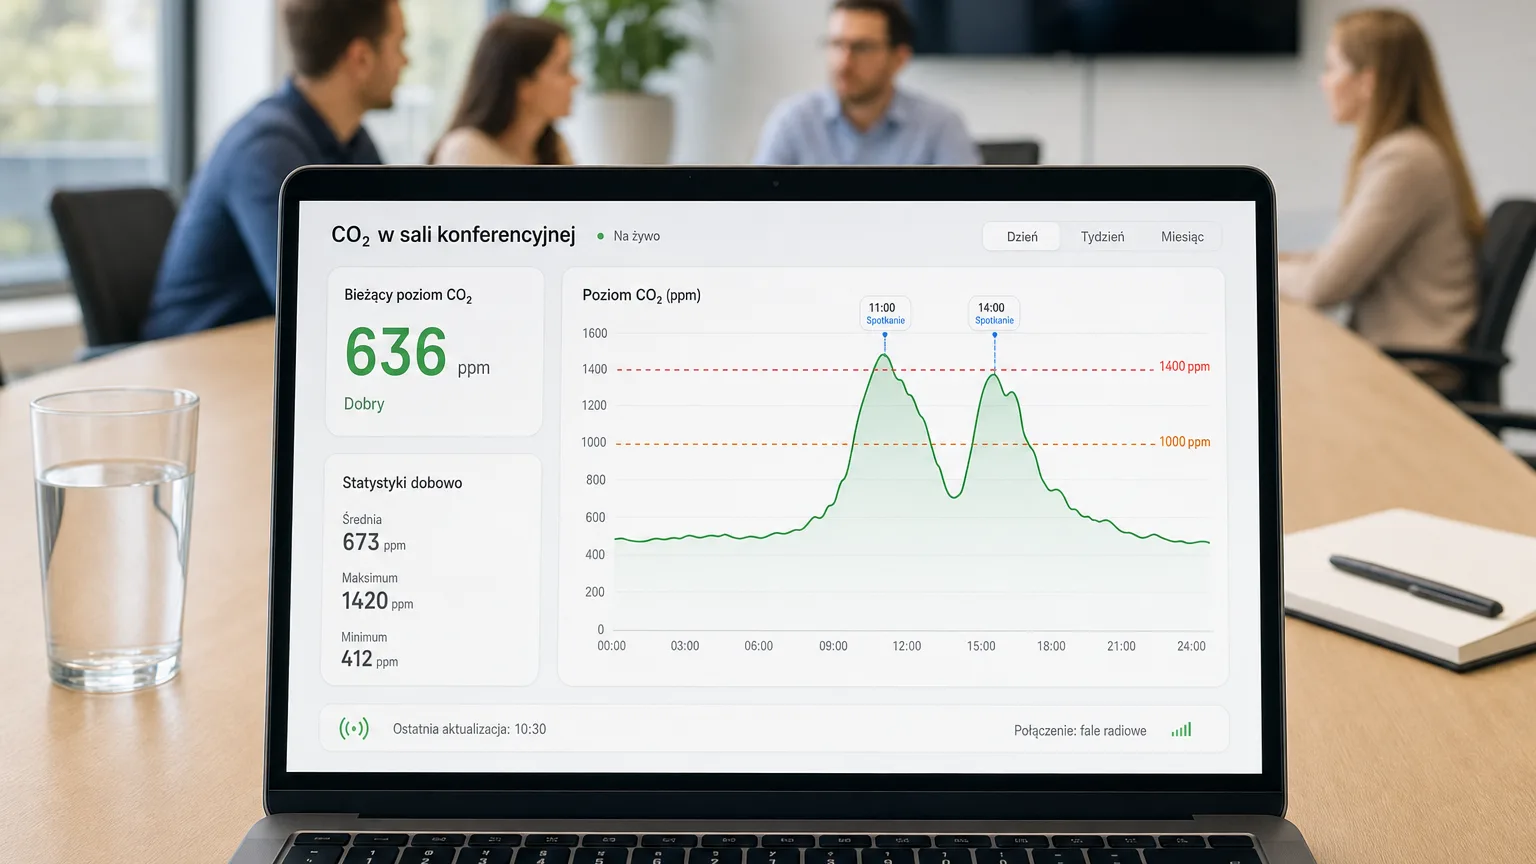
The single most important indicator. Fresh outdoor air contains around 420 ppm of CO₂; in a closed room full of people the concentration rises with every minute of breathing. The reference point for over a hundred years has been the so-called Pettenkofer number — around 1000 ppm as the comfort limit — and the European standard EN 16798-1 defines indoor environment quality categories based, among other things, on CO₂ concentration above the outdoor level. In practice: below 800 ppm is comfortable, and the 1000–1400 ppm band is a clear signal for more intensive ventilation. We break this down in detail in the article on CO₂ standards and thresholds in meeting rooms.
CO₂ has one more advantage: it is an indirect indicator of human presence. The concentration chart of a meeting room shows when the room was genuinely in use — data that's useful well beyond the ventilation question.
Temperature and humidity
The parameter pair behind every office war at the thermostat. What counts here is measurement accuracy: the "it's colder at our end" dispute is settled by a sensor measuring to ±0.2 °C, not a wall thermometer from a supermarket. Humidity completes the picture — air that's too dry in winter (dry mucous membranes, static-charged clothes) and too humid in summer is something everyone feels, though few can point to the cause without a measurement.
TVOC — volatile organic compounds
Particleboard furniture, fresh carpet, cleaning products, a refurbishment one floor up — all of it emits volatile organic compounds. MOX sensors express them as an air quality index on a 1.00–5.00 scale. Here the trend matters more than the absolute value: a jump in the index after weekend cleaning or after new furniture arrives shows up on the chart immediately.
PM2.5 and PM10 particulate matter
Smog from outside, dust, the zones around printers. Particulates are measured with a laser scattering sensor in µg/m³ — in offices on busy streets this is often the parameter that surprises the most, because air that "feels clean" can carry plenty of PM2.5.
Supporting parameters: pressure, light, occupancy
Modern IAQ stations additionally measure barometric pressure, light intensity and motion (with a PIR sensor). From an air-quality perspective the most interesting one is occupancy: setting the CO₂ chart against occupancy data shows in black and white which rooms are overloaded and which stand empty — and lets you drive ventilation and cleaning by the actual use of the space rather than a schedule.
A yearly audit or continuous monitoring
A one-off air quality audit gives you a snapshot of a single moment. But office air lives in a daily cycle: mornings are fresh, by 11:00 the meeting rooms are over their thresholds, after 17:00 everything returns to normal. A spot measurement at 9:00 will see none of it.
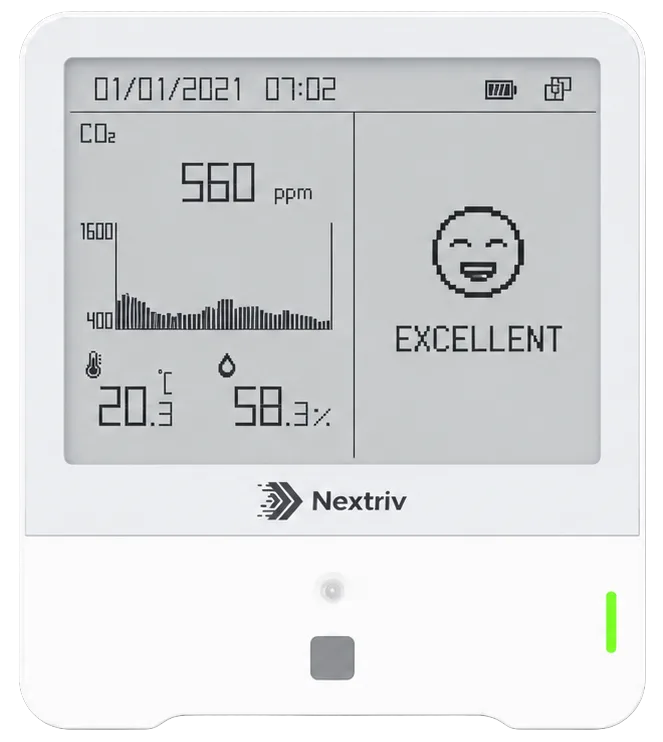
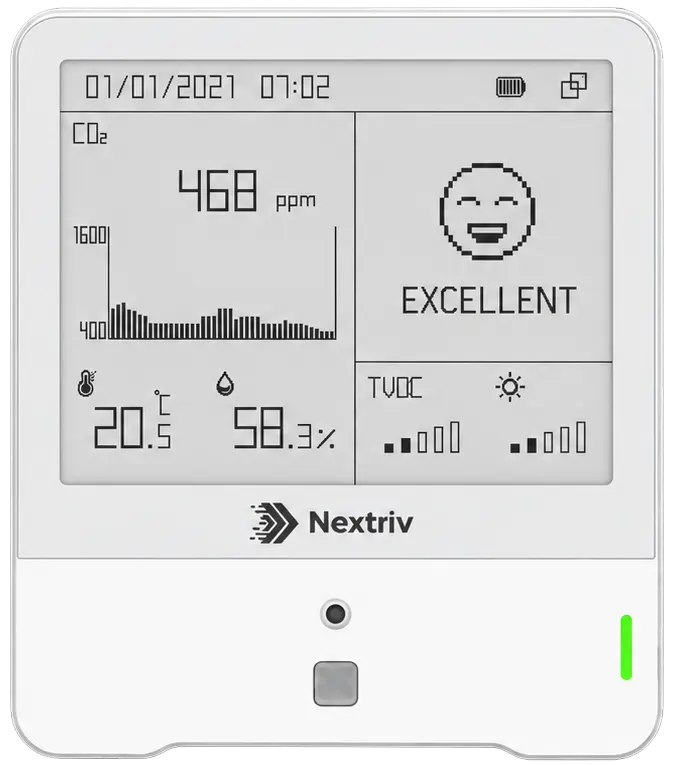
That's why the sensible answer is continuous monitoring — and here technology has made a big difference in recent years. Battery-powered sensors with long-range radio connectivity need no cabling: mounting with tape or screws, several years on batteries, data in the platform every few to a dozen or so minutes. A single device like the Nextriv Sense IAQ measures seven parameters at once: temperature, humidity, CO₂ (with an optical NDIR sensor), TVOC, pressure, light and occupancy. The Sense IAQ Comfort variant adds an eighth parameter — laser measurement of PM2.5/PM10 particulates — wherever dust matters.
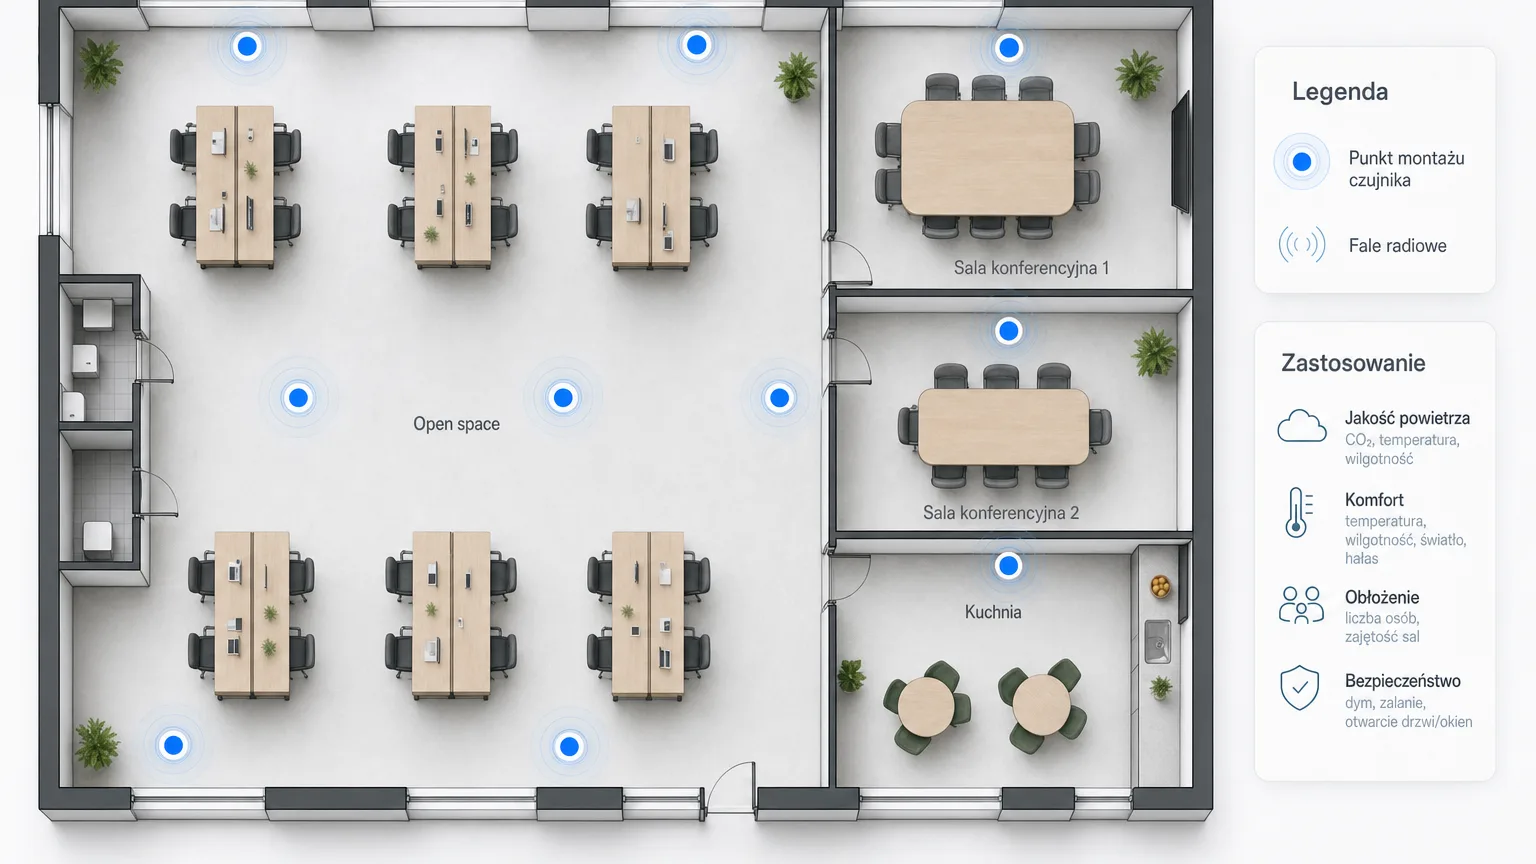
How many sensors an office needs and where to hang them
A practical rule from real deployments: one IAQ sensor per open zone of 100–200 m², plus one in every meeting room — it's in meeting rooms that CO₂ rises fastest. There's no point starting by measuring every single room; better to cover the zones where people actually spend their time and densify wherever the data shows a problem.
It's also worth choosing sensors with a screen. An e-ink display with an emoticon (green, yellow or red) gives the team feedback on the spot — the "air the room or not" decision happens without logging into any app. It's a small thing that makes a real difference to how people take to the system.
What to do with the data so it isn't art for art's sake
Measurement alone changes nothing — the reaction does. In practice, office air quality monitoring rests on three mechanisms:
- Thresholds and alerts. Each metric gets up to four thresholds (warning and critical, lower and upper). Crossing 1000 ppm of CO₂ in a room means a notification to the facility manager — by email, SMS, web push, on Teams or on Discord, depending on where the team works.
- Charts and dashboards. Nearly 20 widget types — from simple KPI gauges to floor plans with sensors overlaid — let you build one view for reception, one for the technicians and one for the board, all on the same data.
- Reports and exports. Scheduled PDF reports with a summary and charts, plus XLSX/CSV exports, feed ESG analyses and tenant conversations with hard numbers instead of opinions. Live readings can also go up on a lobby screen via a public view of selected sensors — no login required.
What this looks like at whole-building scale — from data-driven ventilation to reports supporting BREEAM, LEED or WELL scoring — is described on the solution page for buildings and offices.
Where to start
The cheapest sensible start is a pilot: a few sensors in the most problematic zones — the big meeting room, the open-plan area, the kitchen — and a month of data collection. The FREE plan at Nextriv includes 10 sensors, a gateway and a full year of measurement history, so a pilot requires no software budget at all. After a month, the charts themselves will show whether the problem is meeting-room ventilation, dry winter air or dust from the street.
Check the pricing or book a short demo — we'll show you what air quality monitoring looks like on live data from an office much like yours.


