Sick building syndrome — how to detect it with sensor data
Sick building syndrome leaves traces in data: CO2, TVOC, humidity and particulates explain office headaches. Here's how to find the cause with sensors.
Zespół Nextriv4 min read

Sick building syndrome (SBS) has one trait that sets it apart from a common cold: the symptoms arrive in the building and pass after you leave it. The headache that disappears on the way home. The fatigue that's unbearable on Friday afternoon and nonexistent on Saturday morning. Irritated eyes and a scratchy throat — but only on the third floor. The trouble is that an individual employee doesn't see the pattern, and the employer hears scattered complaints, none of which sounds serious. The pattern only shows in data — which is exactly why the most effective SBS diagnostic tool today is continuous measurement of air parameters, not a one-off site visit.
Sick building syndrome: how to recognise it
The term was introduced when it turned out that in some buildings — usually airtight, air-conditioned, freshly renovated — the share of people reporting complaints was markedly higher than elsewhere, even though no specific disease could be identified. The typical picture:
- headaches, fatigue and concentration problems building up over the working day,
- irritation of the eyes, nose and throat, dry mucous membranes,
- skin symptoms and aggravated allergic complaints,
- a clear correlation with place: symptoms ease or vanish outside the building.
The key word is correlation. SBS rarely has a single cause — it's usually overlapping factors: under-ventilation, emissions from materials, over-dried air, dust. That's why diagnosis "by eye" almost always fails and the discussion gets stuck at "people here just like to complain". Data cuts through that discussion: either the parameters deviate from the norm at the time and place of the complaints, or they don't.
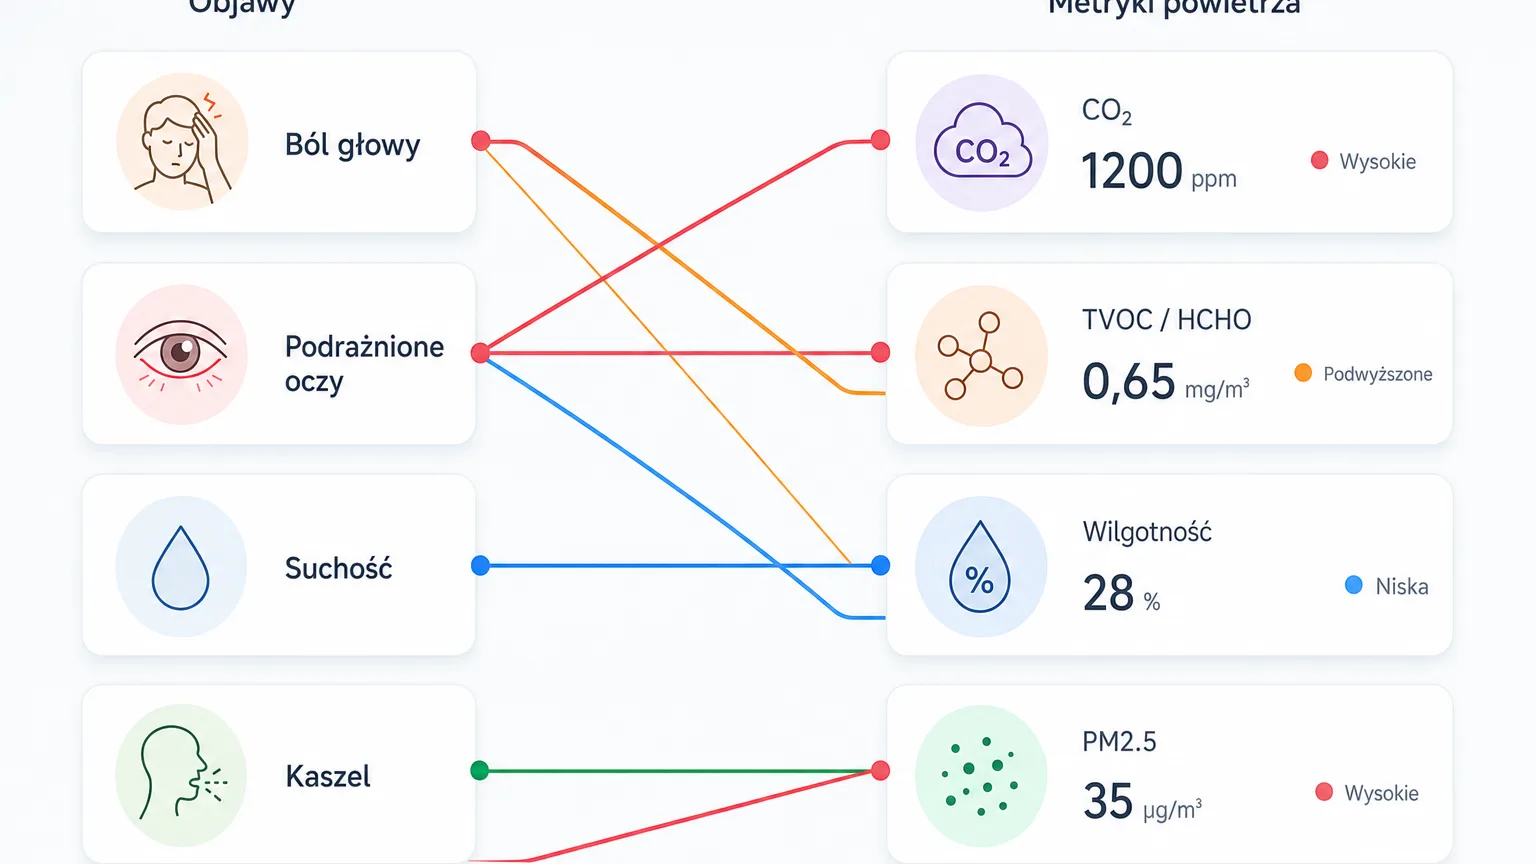
What to measure: a map of symptoms and metrics
Each of the usual SBS culprits leaves a different measurable trace:
| Symptom | Likely factor | The metric that will show it |
|---|---|---|
| drowsiness, headache, drop in concentration | under-ventilation, crowding | CO₂ (rising during working hours) |
| irritated eyes and throat, "chemical" smells | emissions from furniture, carpets, cleaning agents, a fresh renovation | TVOC, formaldehyde (HCHO) |
| dry mucous membranes, static electricity | over-dried air in the heating season | relative humidity |
| coughing, aggravated allergies and asthma | dust, outdoor smog, poor filtration | PM2.5 / PM10 |
| musty smell, recurring infections | damp and mould on cold partitions | humidity + temperature |
Two comments on this table. First, CO₂ is a double indicator: it lowers comfort by itself, but above all it betrays that the ventilation isn't keeping up — and then everything else circulates in the air too. We break down CO₂ thresholds and standards in the article on CO₂ levels in conference rooms. Second, formaldehyde deserves separate attention after every renovation: it evaporates from furniture boards, glues and varnishes for months after handover, long before the concentration reaches the odour detection threshold.
The investigation step by step
Diagnosing SBS with data is in practice a two-to-four-week comparative measurement:
- Place sensors where the complaints are — and in a control zone. Comparing the "sick" floor with a complaint-free zone is the strongest evidence you can put on the table.
- Measure in the occupied zone, away from air vents and windows; one point per open zone and one in each problem room.
- Cross-reference the data with time and occupancy. The SBS pattern is correlation with working hours: CO₂ rising until 2 p.m., TVOC spiking after the weekend cleaning, humidity diving in freezing weeks. A presence sensor distinguishes "empty and fine" from "full and bad".
- Put the results on a floor plan. Sensor markers on the storey layout show whether the problem affects the whole building (air handling, filtration), one zone (a local emission, a thermal bridge) or one room.
- Set thresholds and collect events. Four thresholds per metric, events with codes and statuses — after a month, the alarm list alone is a ready-made report on what exceeds the norms, where and how often.
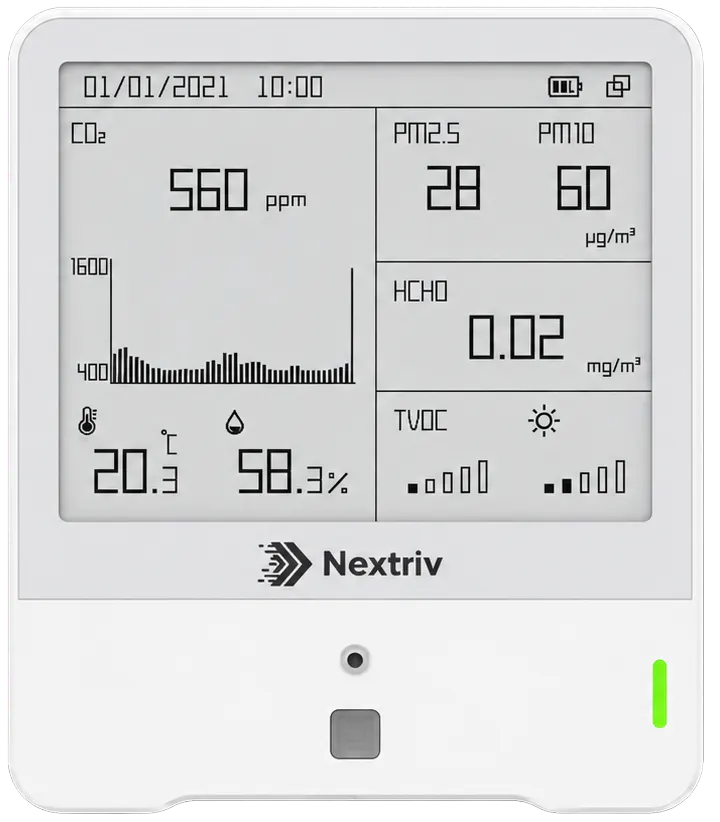
What to measure with: one device for the whole investigation
An SBS investigation requires a wide spectrum of metrics at once — and an ordinary temperature sensor won't do. Nextriv Sense IAQ Pro measures nine parameters from a single mounting point: temperature, humidity, CO₂, TVOC, PM2.5/PM10 particulates, pressure, light, presence and — your choice — formaldehyde (0–1.25 mg/m³, 0.01 mg/m³ resolution) or ozone. That's exactly the set needed for the table above, including the hardest-to-capture HCHO after renovations. The device also carries a conformity marking for the WELL healthy building certification programme — the collected data is suitable not only for diagnosis but also for later environmental quality reporting.
In larger offices it's worth placing the 9-in-1 station in the problem zones and covering the remaining floors with simpler sensors — you'll find an overview of the whole device ladder from 3 to 9 parameters in the article on what good office air quality is.
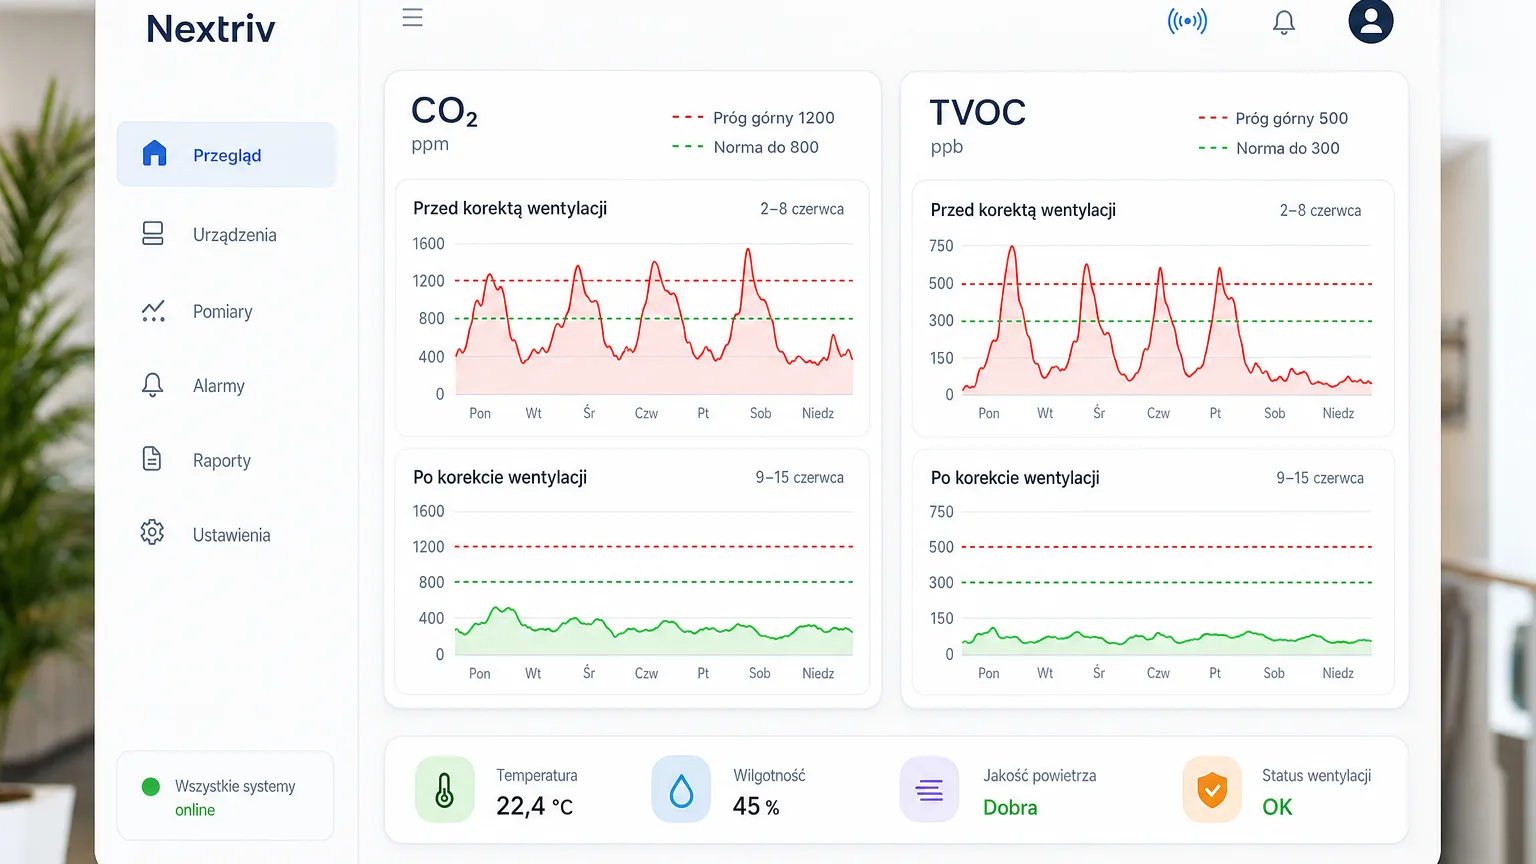
From diagnosis to repair
The data points to the cause — and immediately suggests the remedy. High CO₂ at peak hours is an argument for demand-controlled ventilation, which ventilates full zones instead of empty ones. Winter dryness leads to the topic of optimal indoor humidity and humidification. TVOC spikes after cleaning are fixed by changing the products or the schedule; elevated PM — by reviewing the filtration of the air handling units.
The monitoring stays around longer than the investigation itself: thresholds make sure the problem doesn't come back, notifications reach the facility manager through one of six channels, and PDF reports with compliance sections document the improvement — a "before and after" chart is the best way to close the topic with the team and the board. Measurement history reaches up to 5 years, so comparing heating seasons year on year takes no extra work.
The full scenario of environmental quality supervision in an office building — from pilot to tenant reporting — is described on the solution page for buildings and offices.
Start before the complaints reach HR
The worst SBS strategy is waiting until scattered complaints grow into an HR problem. A pilot is cheap and fast: a few sensors in the complaint zone and the control zone, a month of data, one meeting over the charts. The FREE plan covers 10 sensors and a year of history — enough for a full investigation in a mid-sized office.
Book a demo — we'll show what such a diagnosis looks like on live data — or check the pricing and price the pilot yourself.


