Smart office — where to start: office monitoring step by step
Smart office monitoring step by step: which zones to measure, how to install sensors with no cabling, and how to set up alerts and dashboards.
Zespół Nextriv4 min read

In this article
- What smart office monitoring is and how it differs from automation
- Step 1. Choose zones and parameters — not the whole building at once
- Step 2. Installation with no cabling — an hour instead of a project
- Step 3. Set thresholds and alerts — so the data isn't wallpaper
- Step 4. Dashboards, reports and a screen at reception
- From pilot to office standard
Smart office monitoring starts not with automation and not with a desk booking app, but with data: where it's stuffy, where it's too cold, which rooms run around the clock and which stand empty. Without this layer, any building "intelligence" flies blind — schedules instead of real usage, opinions instead of measurements. The good news is that the measurement layer of a smart office can now be launched in a single afternoon: wireless sensors, one gateway and a platform that turns readings into alerts and charts. Below are the four steps every sensible rollout goes through.
What smart office monitoring is and how it differs from automation
Two different things hide under the "smart office" label. The first is automation: controlling lighting, blinds, air conditioning. The second is monitoring: continuous measurement of conditions and space utilisation. The order matters — automation without data steers by a rigid schedule, i.e. exactly like a "dumb" building, only at greater expense. Monitoring without automation shows within a month where energy and comfort are leaking. That's why mature rollouts start with measurements and add automation later — with evidence in hand.
In practice, office monitoring covers three groups of data:
- climate and air quality — temperature, humidity, CO₂, volatile organic compounds (TVOC), and in dusty zones also PM2.5/PM10 particulates;
- space utilisation — presence and motion in rooms, zones and break areas;
- events — threshold breaches, offline devices, after-hours movement.
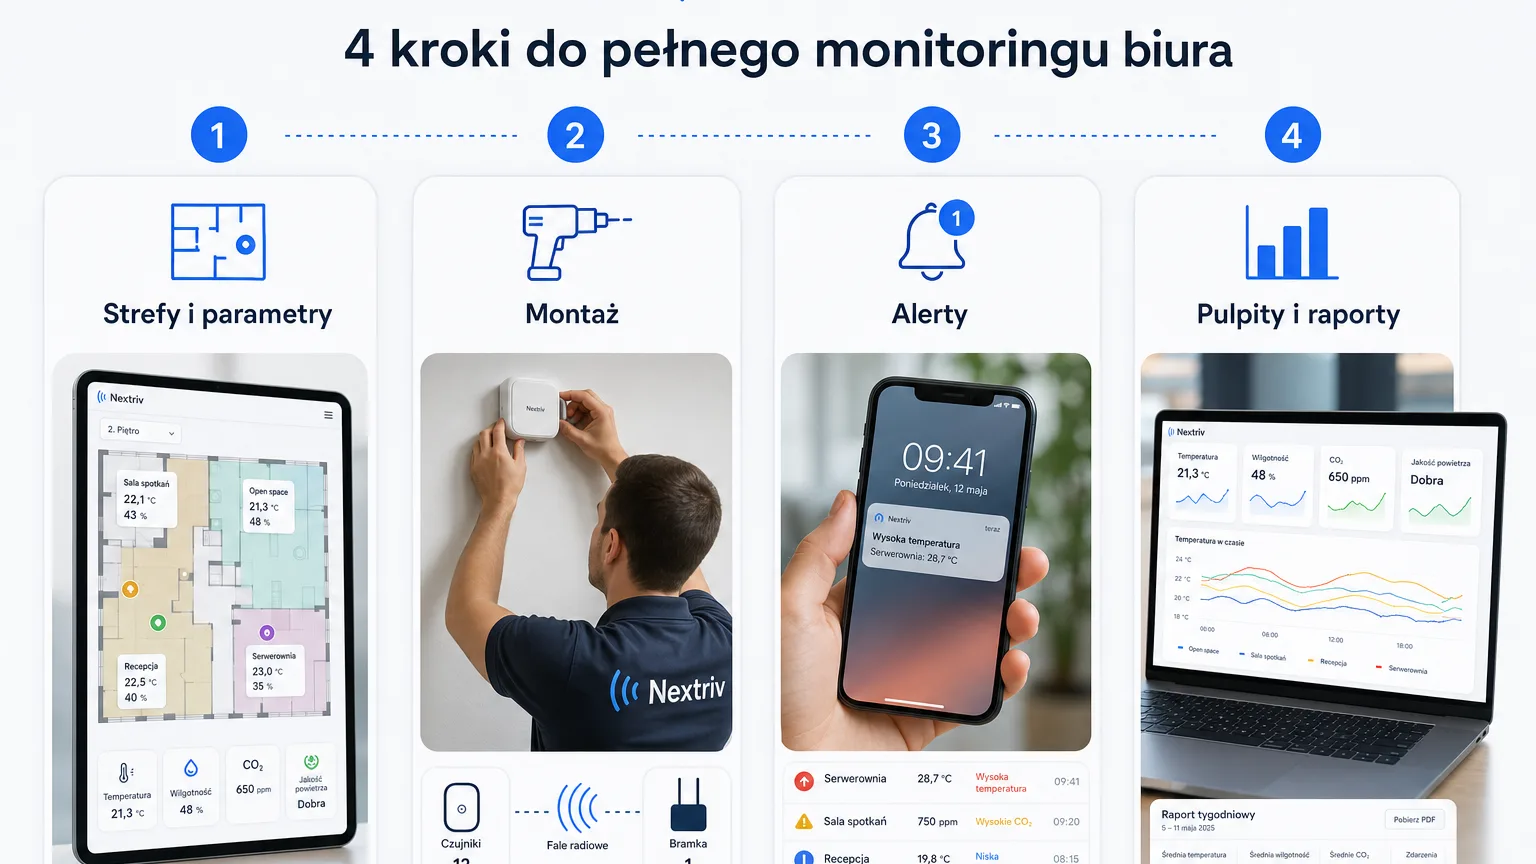
Step 1. Choose zones and parameters — not the whole building at once
The most common mistake is trying to cover every room with sensors from day one. Better is a rule proven in deployments: one multi-parameter sensor per open zone of 100–200 m², plus one in every conference room — it's in meeting rooms that CO₂ rises fastest, which we break down into thresholds in the article on CO₂ in conference rooms. Add the kitchen or break area — the places where complaints about it being "stuffy" come up most often.
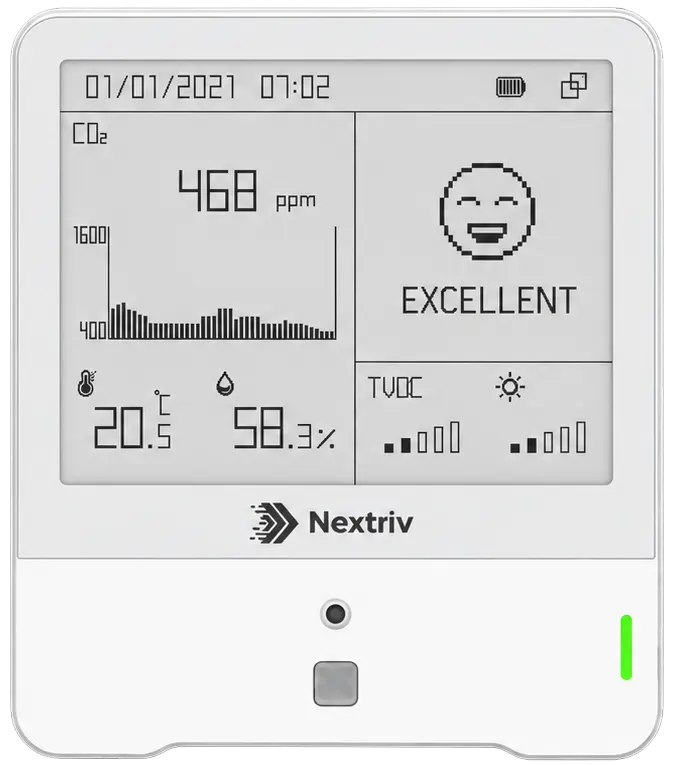
Instead of seven separate devices, a multi-parameter station works smarter: Nextriv Sense IAQ measures temperature, humidity, CO₂ (with an optical NDIR sensor), TVOC, pressure, light and presence — seven parameters from a single installation, with an e-ink screen that tells the team on site when to air the room. In entrance halls, next to printers and in offices on busy streets, it's worth reaching for the variant with laser particulate measurement:
Step 2. Installation with no cabling — an hour instead of a project
In wired building systems this step can cost more than all the hardware: cable runs, suspended ceilings, a crew, a design. In a wireless system it looks like this:
- Gateway — you connect it to power over USB-C or PoE and to the internet. One handles many sensors within a radius of about 2 km in built-up areas (up to 15 km in open terrain), so it covers a typical office with room to spare.
- Sensors — mounted with 3M tape or two screws, configured by tapping a smartphone (NFC). No junction boxes, no electrician.
- Platform — new devices are detected automatically within 30–180 seconds of power-up and start reporting right away.
The sensors run about 3 years on replaceable batteries at a 10-minute measurement interval, and a local buffer (up to 18,000 records in the IAQ stations) backfills measurements after any connectivity outage — the history has no gaps. The system also watches itself: a sensor that goes silent for twice its reporting interval is marked offline; a gateway — after 15 minutes of silence.
Step 3. Set thresholds and alerts — so the data isn't wallpaper
Measurement alone changes nothing; the response does. In Nextriv every metric has up to four thresholds (warning and critical, lower and upper). A reasonable starting point for an office: CO₂ at 1000 ppm as a warning and 1400 ppm as critical, temperature with warnings outside the 20–26 °C band — and after a month of data you tune the thresholds to your own building.
Notifications arrive where the team actually works: email, SMS, web push, Microsoft Teams, Discord or an audible alarm in the app. Three mechanisms protect against alert fatigue: quiet hours for nights and weekends, a limit of 3 notifications per 5 minutes per recipient, and escalation policies — if nobody acknowledges an alarm within a set time, the information goes a level up, e.g. by SMS to the facility manager.
Step 4. Dashboards, reports and a screen at reception
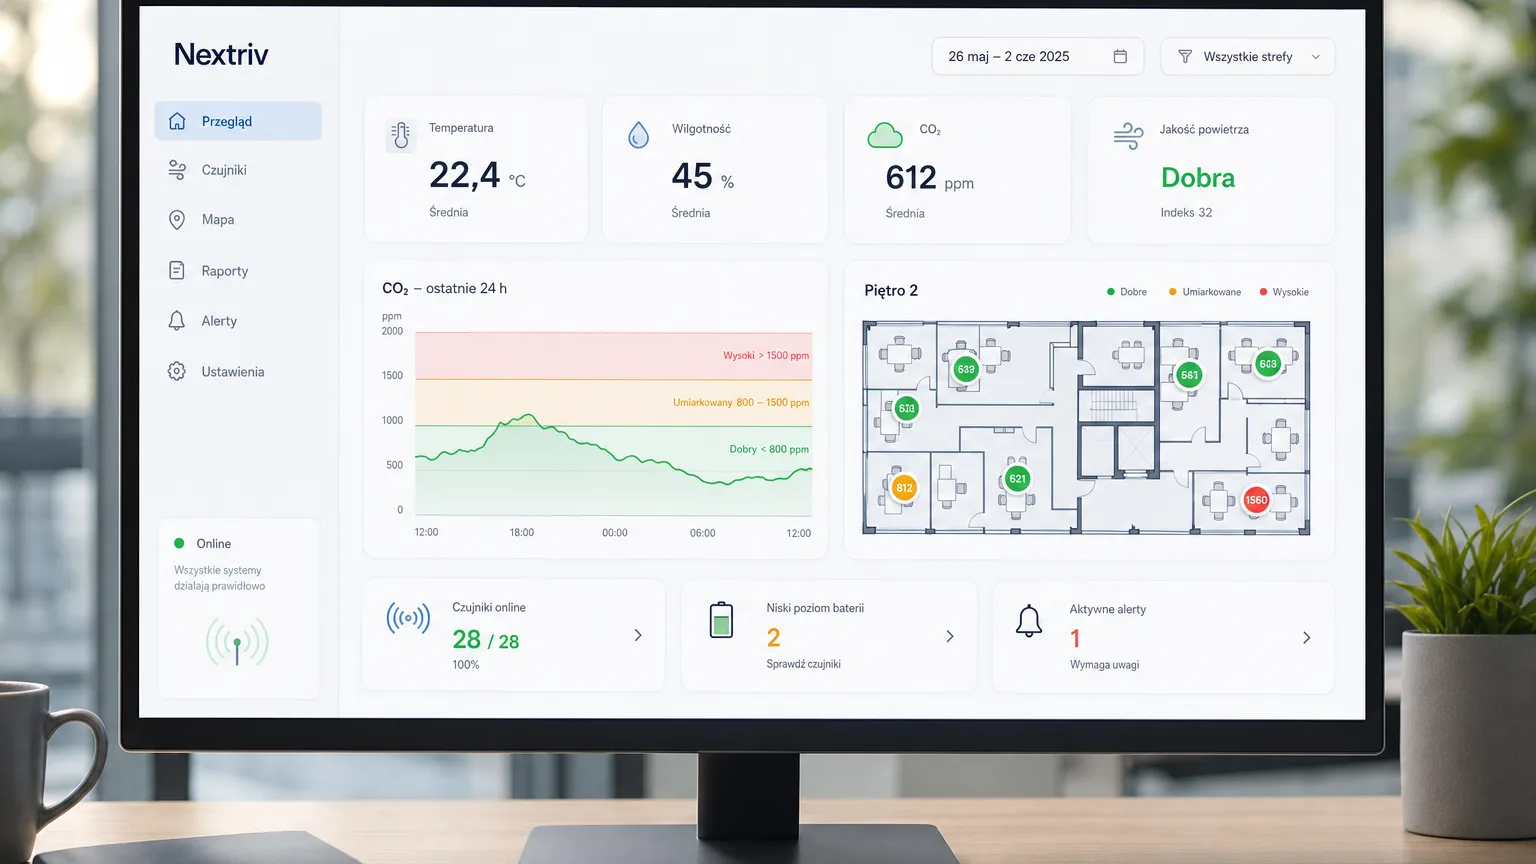
Sensor data lands on configurable dashboards — there are nearly 20 widget types available, from simple KPI indicators through multi-series charts to a floor plan with sensors placed on it. The office manager sees zone comfort, the technician a list of devices and alarms, the board quarterly trends — everyone on the same data. Especially instructive is overlaying the CO₂ chart with occupancy: it shows in black and white which rooms are overloaded and which are booked "just in case".
PDF reports with summaries and charts plus XLSX/CSV exports feed ESG analyses and tenant conversations with hard numbers. Live readings can additionally be shown on a lobby screen via a public view of selected sensors — with no sign-in. What this looks like at the scale of a whole site, from data-driven ventilation to reporting, we describe in the solution for buildings and offices.
From pilot to office standard
The best first smart office project is a pilot on one floor: a few sensors in the most used rooms and the open space, a month of data collection, a chart review with the facility manager. The FREE plan covers 10 sensors, a gateway, 5 alert rules and a full year of measurement history — so the pilot needs no software budget at all, and afterwards the expansion decision is made by data, not by a salesperson's deck.
Check the pricing or book a short demo — we'll show office monitoring on live data, complete with alerts and a dashboard for your team.


