Thermal comfort in the office — standards, measurement and automatic alerts
Thermal comfort in the office without guesswork: temperature and humidity standards, accurate sensor measurement and alerts before complaints pile up.
Zespół Nextriv4 min read

Thermal comfort in the office can divide a team more effectively than any board decision. Half the open-plan floor is freezing, the other half is suffocating, and the dispute is settled by whoever sits closest to the thermostat. The trouble is that without measurement both sides are right: the same zone can simultaneously be 21 °C by the window and 26 °C under the air vent. Turning impressions into numbers — credible measurement, sensible thresholds and automatic alerts — ends these wars faster than another survey would. Below we organise what standards say about office temperature and how to build supervision that reacts before the complaints pile up.
Thermal comfort in the office by standards and regulations
Three sources of values worth citing in the discussion:
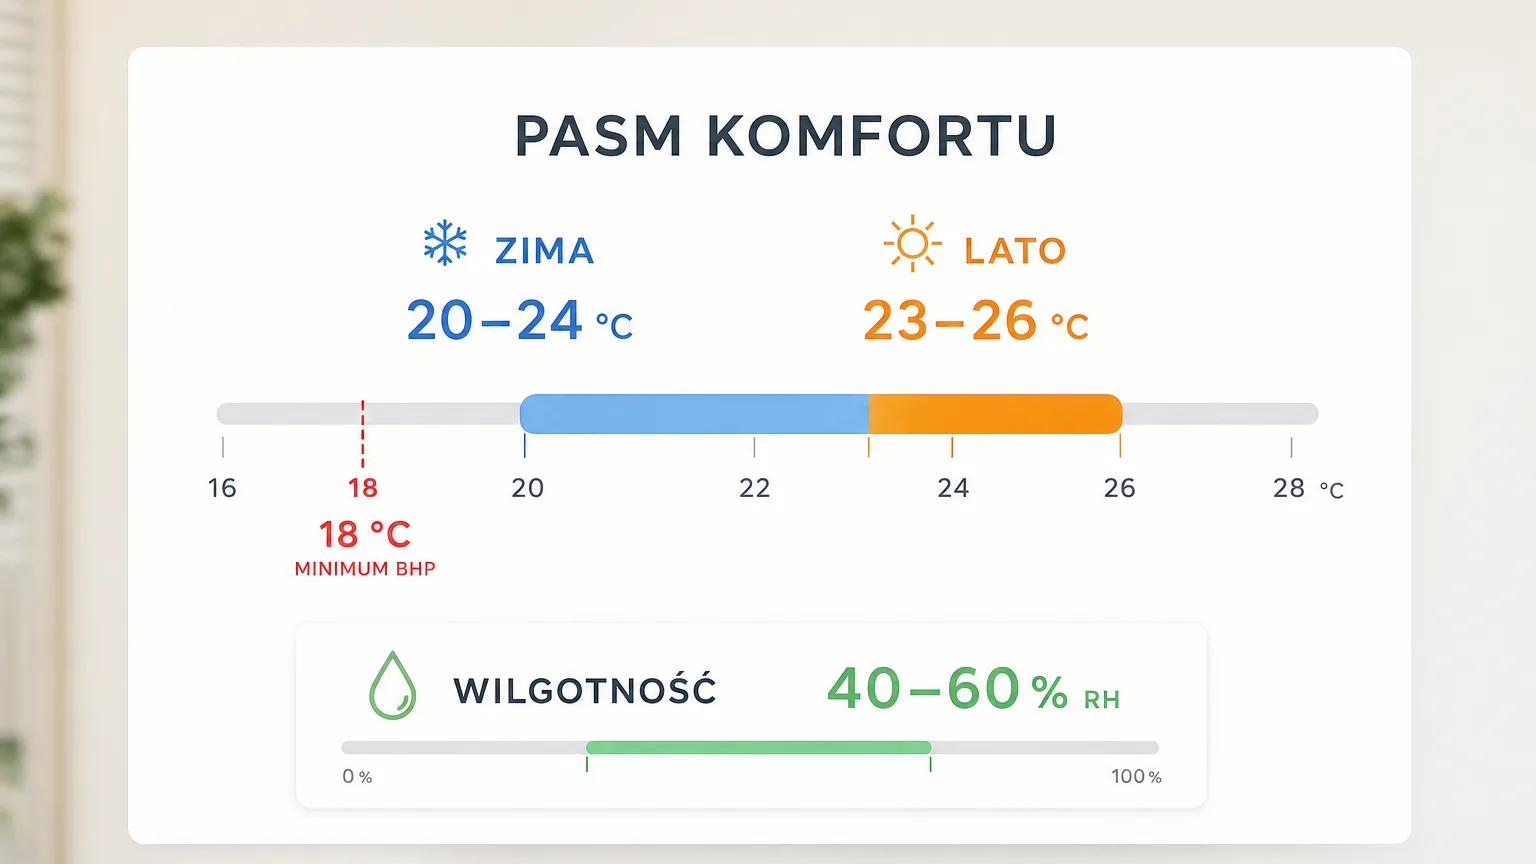
Occupational health and safety regulations. Polish OHS rules require a temperature of no less than 18 °C in rooms where light physical and office work is performed. That's a legal minimum — the line below which the employer has a formal problem, not a level at which anyone works well.
EN 16798-1. The European standard for indoor environmental parameters defines quality categories (I to IV), including for the thermal environment. For offices in the middle category II, the usual assumption is around 20–24 °C in the heating season and 23–26 °C in the cooling season — the difference comes from the fact that in summer we dress lighter and accept higher temperatures.
ISO 7730 (the PMV/PPD model). Fanger's classic research reminds us that thermal comfort is more than air temperature: radiant heat (a cold window, a sun-baked façade), air movement, humidity, activity and clothing all count. The PPD index describes the percentage of dissatisfied people — and even in ideal conditions about 5% remain dissatisfied. That's an important calibration of expectations: the goal isn't zero complaints, but conditions in a band where complaints are the exception.
Relative humidity completes the picture — 40–60% RH is usually taken as comfortable. In winter, over-dried air (dry mucous membranes, static-charged clothes) can generate complaints "about the AC" that have nothing to do with temperature.
Measurement: accuracy and mounting location make the difference
Thresholds from the standards only make sense with credible measurement. Two things decide:
Sensor accuracy. The "it's colder at our end" dispute is settled by a measurement accurate to ±0.2 °C and ±2% RH — not a supermarket wall thermometer that can be off by two degrees, i.e. the entire width of the comfort band.
Mounting location. The sensor goes in the zone where people actually are — at seated height, away from the air vent, the window and heat-emitting equipment. A measurement near the ceiling or above the printer measures the climate of the ceiling and the printer, not of the workstations. In larger zones it's worth hanging two sensors (e.g. by the façade and deeper inside) — the difference between them is often the whole diagnosis: if it's consistently 3 °C colder by the windows than further in, the problem isn't the air-handler setpoint but the perimeter zone, which no amount of thermostat-twiddling will fix.
Continuity matters too. A one-off measurement shows one moment, and comfort breaks down in cycles: Monday mornings after the weekend heating setback, sunny afternoons on the south elevation. A battery sensor reporting every few to a dozen or so minutes builds a picture you can actually argue with.
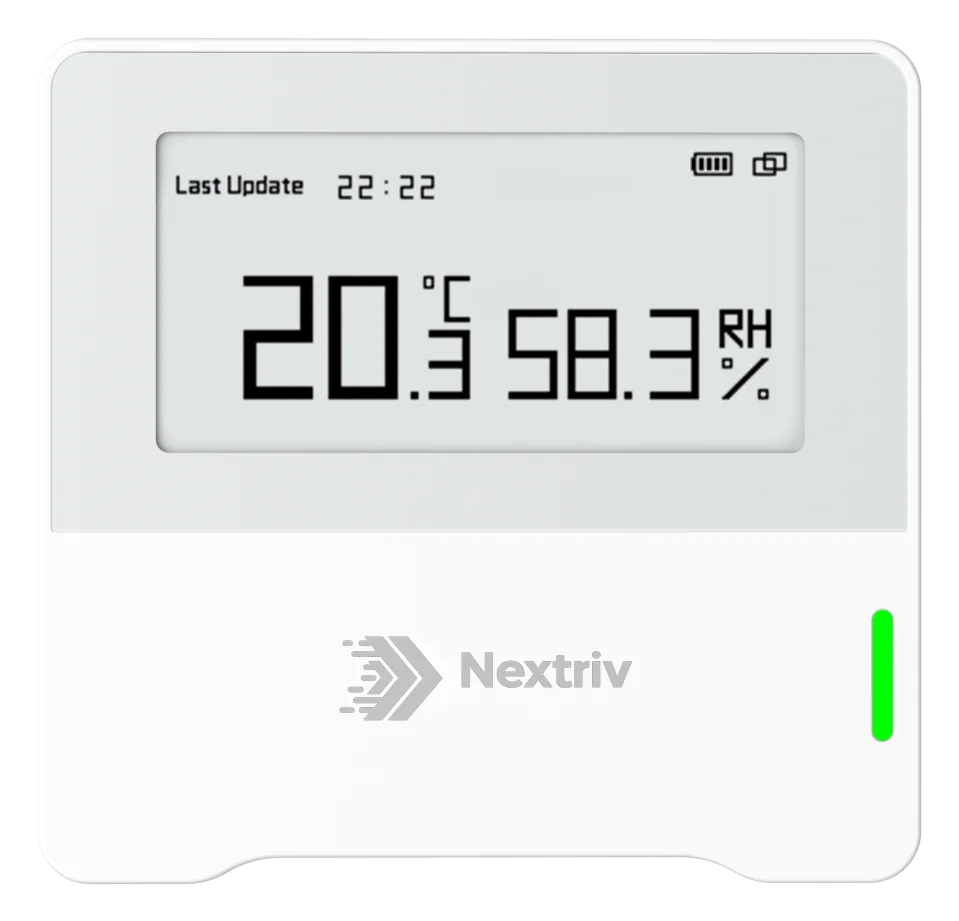
For thermal comfort itself, a precise temperature and humidity sensor with a screen is enough — an on-the-spot reading cuts the "so what is it really" debates short:
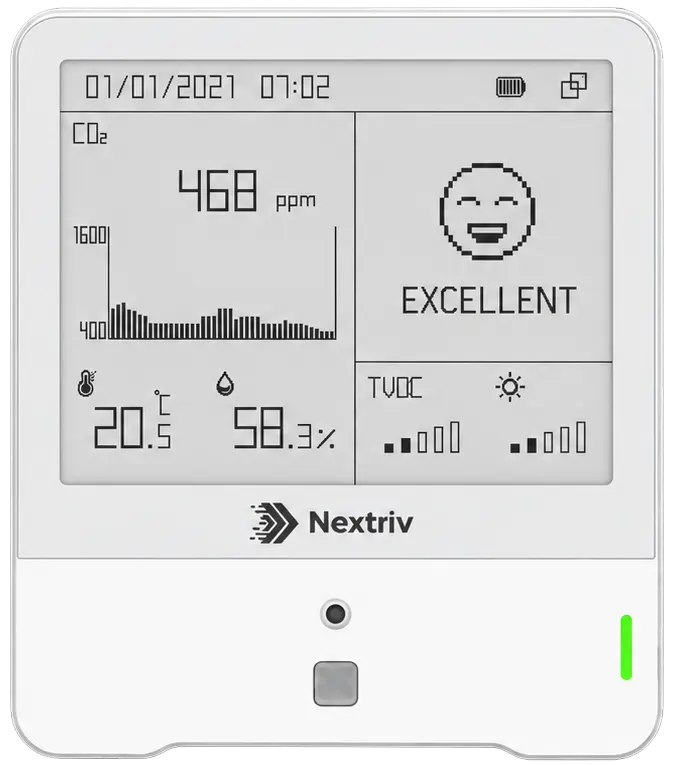
Where the complaints also mention stuffiness and "heavy air", a fuller picture comes from a multi-parameter station that additionally measures CO₂, TVOC and particulates — thermal comfort and air quality often turn out to be one and the same ventilation problem. How to measure the remaining parameters is covered in the article on office air quality.
Automatic alerts: from threshold to reaction
Manually checking charts ends after a week. Supervision that works rests on thresholds and notifications:
- Four thresholds per metric. Office temperature needs thresholds on both sides: warning and critical, lower and upper. A sensible starting point: a warning outside the 20–26 °C band, critical below 18 °C (the OHS minimum) and above 28 °C. For humidity, analogous bands around 40–60% RH. These are starting values, not dogma — after a season of data you tune them to the building.
- Six notification channels. Email, SMS, web push, Microsoft Teams, Discord and an audible in-app alarm — the alert about an overcooled zone reaches the facility manager wherever they actually work. Every event has a code and a severity, so in communication with the HVAC service there's no doubt which alarm is meant.
- Escalations and alert hygiene. If nobody acknowledges the event, the notification goes one level up. Quiet hours mute the nights and weekends, and when the temperature returns to the band the system itself sends the all-clear.
Alerts catch failures and excursions, but chronic problems only show up in trends: a south-facing zone overheating every sunny afternoon, a room freezing on Monday mornings after the weekend heating shutdown. That's where the history charts and PDF reports with a summary and charts come in — ready material for a conversation with the HVAC service or the building manager, plus XLSX/CSV exports for your own analyses. The whole scenario at building scale — from sensors to comfort reporting — is described in our solution for buildings and offices.
From complaints to data in one month
A practical start needs neither a project nor a software budget: a sensor in the coldest and the warmest zone (wherever most complaints come from), one in each key room, thresholds at 20–26 °C and a month of data collection. The FREE plan includes 10 sensors, a gateway and a full year of measurement history — enough to put charts on the table instead of opinions. Mounting means tape or screws and configuration over NFC, with no cabling.
Check the pricing or book a short demo — we'll show temperature alerts in action, escalation included, plus the report that settles the office thermostat war with data rather than a vote.


