How to cut a building's carbon footprint with measurement data
A building's carbon footprint starts falling once you know what uses energy: per-device kWh metering, CO₂-driven ventilation and ESG-ready reports.
Zespół Nextriv4 min read

A building's carbon footprint has stopped being a conference topic and become a line item in reports: tenants ask about emissions, banks about ESG, and owners about bills growing faster than rents. The trouble is that most buildings "know" their carbon footprint from a single number — the total energy invoice, converted once a year with an emission factor. Such a number lets you report, but it doesn't let you improve anything, because it doesn't say what uses the energy, when, and whether it has to. Reduction only starts once measurement data appears between the invoice and the decision.
Where a building's carbon footprint comes from
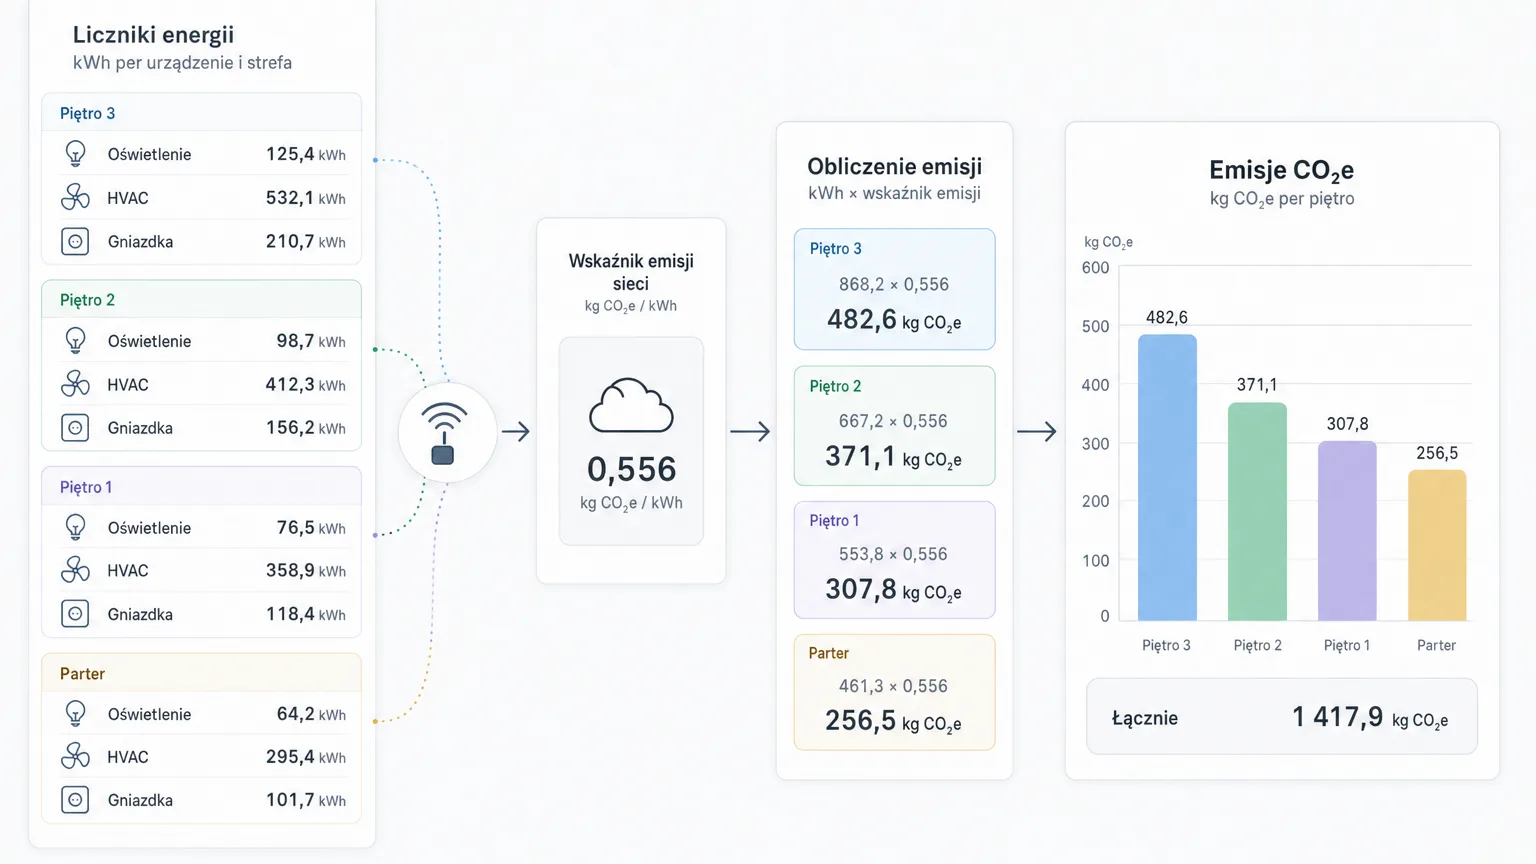
In the use phase, a building's carbon footprint is in practice two items: electricity, and heating and cooling. In reporting nomenclature, fuels burned on site (e.g. a gas boiler room) go into scope 1, and energy bought from the grid — into scope 2. From a reduction standpoint, though, the mechanism is the same: every kilowatt-hour has an emission factor published for the national grid, so every kilowatt-hour the building doesn't use is a concrete number of kilograms of CO₂e off the report — and concrete money off the invoice.
That's why the question "how to lower a building's carbon footprint" reduces to two simpler ones: where is energy escaping pointlessly, and how do you prove it with data. From an aggregate invoice you'll answer neither — from per-device and per-zone measurements you'll answer both.
Step 1: measure what really uses energy
Energy audits usually founder on a lack of detailed data: the main meter shows the total, and expanding the metering of the switchboard is a project involving an electrician and downtime. Meanwhile, a large share of office loads can be metered without touching the wiring at all — with a smart pass-through plug inserted between the plug and the socket.
Nextriv Control Plug reports voltage, current, active power and cumulative kWh separately for every connected device — from the coffee machine to a single machine. After two weeks of such measurement, the classic "energy vampires" usually come to light: printers, monitors and water dispensers running on standby all night and all weekend, i.e. for most hours of the week. And because the same plug can also switch, the diagnosis immediately turns into the cure: a schedule cuts off unneeded loads after hours and switches them back on before the team arrives, and group control turns off a whole floor with a single command. An overload alarm and a power loss alert come included.
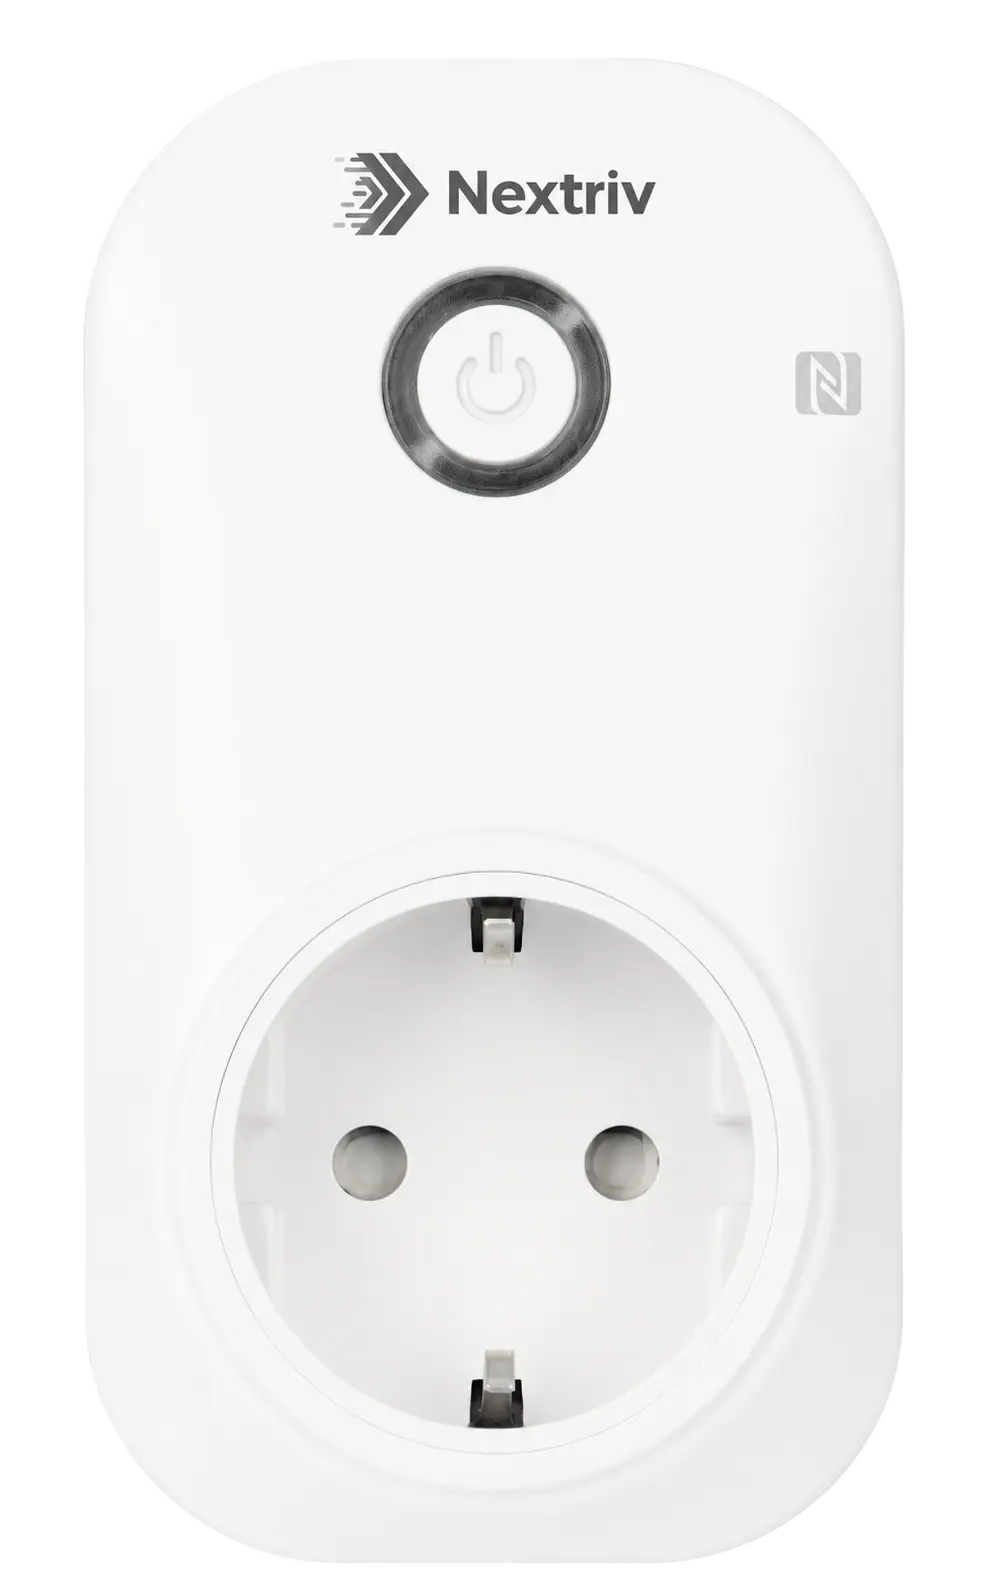
The effect is measurable with the same tool that produced it: the per-device kWh meter shows consumption before and after, so the saving isn't an estimate from a brochure but the difference between two readings.
Step 2: ventilate and heat by data, not by schedule
The second big reservoir of savings is ventilation and heating running "just in case". An air handling unit ventilates an empty conference room as diligently as a full one, because the schedule doesn't know how many people are inside. CO₂ concentration does — it only rises when someone is in the room, so it works as a proxy occupancy indicator.
Nextriv Sense CO₂ measures carbon dioxide optically (NDIR — a technology that doesn't drift over the years), plus temperature with ±0.2 °C accuracy and humidity at ±2% RH. This data lets you move from ventilation "by the clock" to demand-controlled ventilation: the building ventilates when CO₂ actually rises, instead of running at full capacity all day. We take this approach apart piece by piece in the article on CO₂-controlled ventilation.
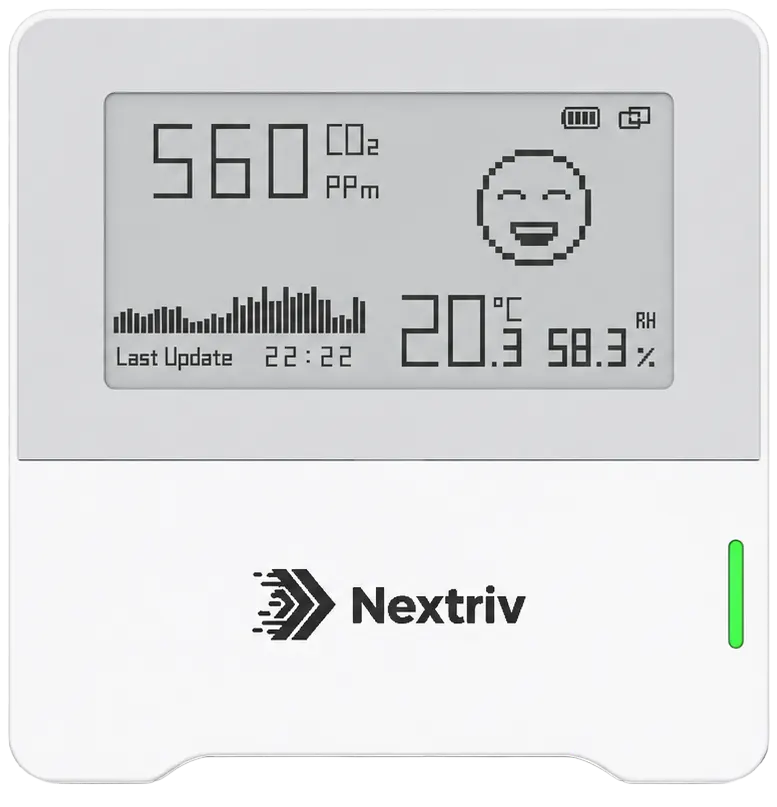
One important caveat: reducing the carbon footprint must not mean degrading working conditions. That's why measuring CO₂, temperature and humidity plays a dual role here — on the one hand it shows where ventilation and heating run in excess, on the other it makes sure the savings don't sink below the comfort band. Four thresholds per metric (warning and critical, on both sides of the range) mark the boundaries within which optimisation is safe, and alerts will catch any attempt at "saving at people's expense".
Step 3: from kilowatt-hours to a report
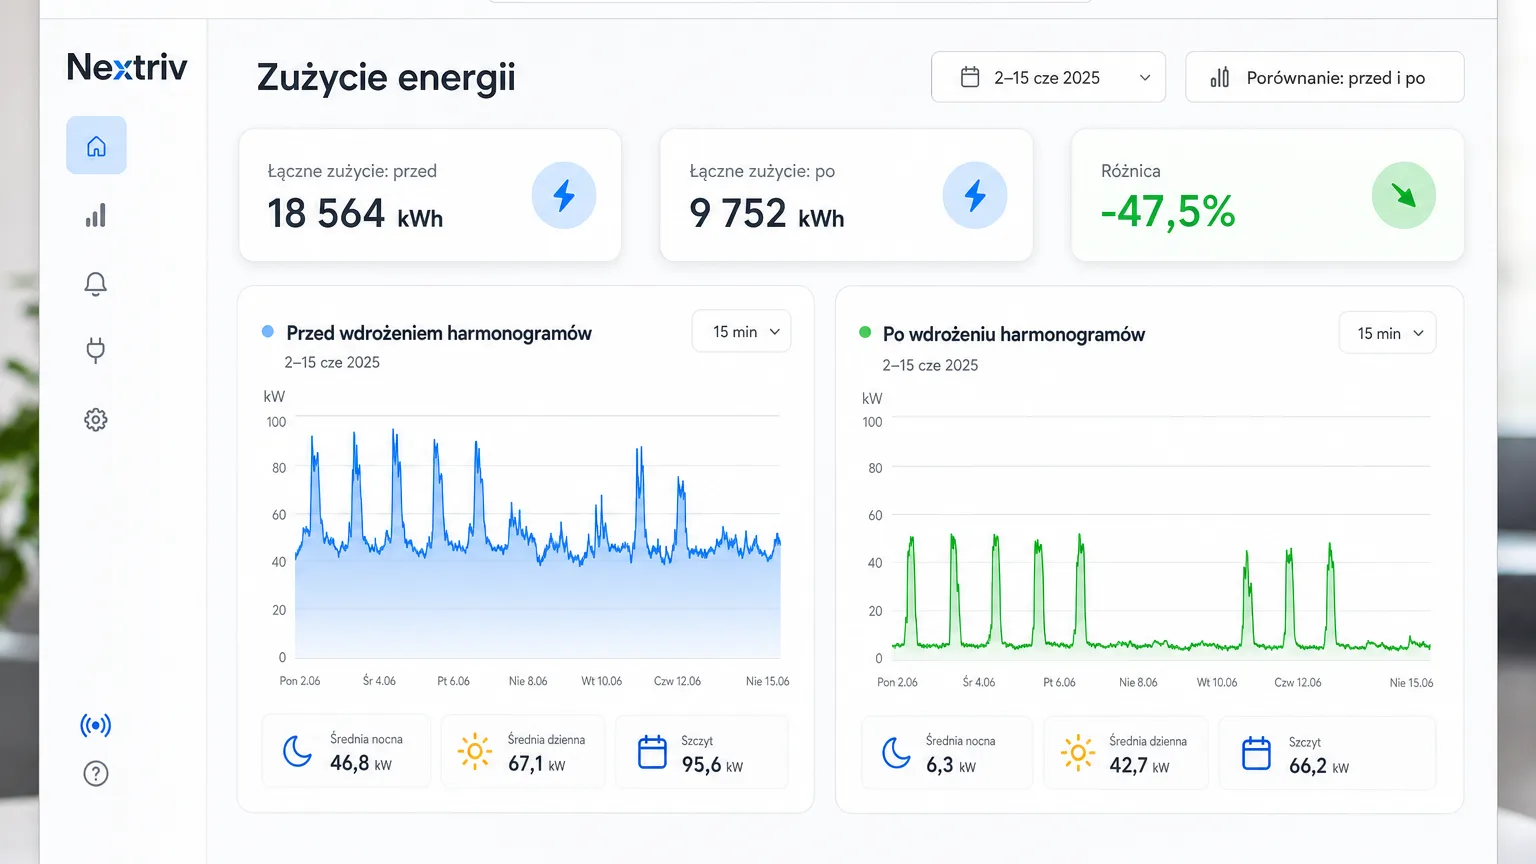
Data that doesn't make it into a report doesn't exist for ESG. This is where the platform works: kWh readings from many plugs can be combined with a sum-type virtual sensor into a single floor or tenant meter, KPI widgets and trend charts show consumption on a dashboard, and period comparisons reveal whether the schedules really work.
For external reporting there are XLSX and CSV exports — raw kilowatt-hours straight into the spreadsheet where you calculate emissions with the factor appropriate to your energy supplier — and cyclic PDF reports with charts and statistics as material for the board or tenants. Measurement history reaches up to 5 years, so the year-on-year comparisons that honest reporting requires don't end after one season. We wrote more about calculating the return on such a rollout in the piece on the ROI of environmental monitoring.
A plan for the first quarter
Reducing a building's carbon footprint doesn't require thermal retrofitting to get started. A sensible sequence looks like this:
- Weeks 1–2: plug metering plugs into the most suspicious loads and put CO₂ sensors in the most used zones. Zero interference with the wiring.
- Weeks 3–4: collect baseline data. Don't change anything yet — you need a reference point.
- Month 2: roll out schedules for loads running after hours and adjust the ventilation where CO₂ shows empty zones.
- Month 3: compare the consumption profiles before and after, convert the difference into CO₂e and money, and decide on the scale of expansion.
Energy and condition monitoring arranged like this is the foundation of the broader scenario we describe in the solution for buildings and offices — from single plugs to dashboards for the whole site.
Want to see the per-device kWh meter and data-driven ventilation on a live system? Book a short demo or take a look at the pricing — the free plan is enough to measure your first "vampires" within a month and show the board the difference in data, not in declarations.


