Legionella and Water Temperature Monitoring — What the Data Shows
Water temperature monitoring helps control Legionella risk but cannot detect bacteria. Learn where to measure, how to alarm and where the system's limits lie.
Zespół Nextriv6 min read
In this article
- Why temperature matters without providing a diagnosis
- Where to measure in a building water system
- Turning a reading into an alarm that leads to action
- Choosing the measurement method
- What central Nextriv monitoring contributes
- The trend complements a manual round; it does not cancel it
- Implementation checklist
- Sources
Water temperature monitoring is one of the most practical tools for controlling Legionella risk in a hotel, hospital, care home, student residence or large office building. It does not, however, answer the question: “Are there bacteria in this system?” Temperature is not a microbiological test. What it can show is whether the installation is operating under conditions intended to limit growth, and where and when those conditions are no longer being maintained. That distinction matters: well-designed monitoring provides an earlier signal for action, but it does not replace a water safety plan, sampling, flushing, disinfection or a risk assessment led by the people responsible for the water system.
Why temperature matters without providing a diagnosis
Legionella can multiply in building water systems, particularly when a favourable temperature combines with stagnation and conditions that support biofilm. Poland's National Institute of Public Health (NIZP PZH) identifies approximately 25–45°C as a range that supports growth. This is not an on/off boundary between “safe” and “unsafe”. A brief reading of 42°C does not prove contamination, while one result of 55°C does not prove the whole system is free of bacteria.
Risk is also affected by dead legs, infrequently used outlets, scale, corrosion, ineffective circulation and the age of the installation. Temperature is therefore an operating-condition indicator. A continuous trend can reveal that the circulation loop cools overnight, a remote wing never reaches its target or cold water warms in a service riser next to a hot pipe. A periodic round with a handheld thermometer may miss all three patterns.
WHO guidance recommends hot water leaving the heater at no less than 60°C and remaining above 50°C throughout the system, while cold water should stay below 25°C and preferably below 20°C. Polish NIZP PZH material likewise points to below 20°C for cold water and above 50°C at hot-water outlets. The applicable controls in a particular facility must still come from its risk assessment, procedures, system design and current legal requirements. Scalding risk must be controlled at the same time — increasing the outlet temperature without reviewing mixing and anti-scald measures is not an acceptable shortcut.
Where to measure in a building water system
A single sensor in the plant room says little about conditions across an entire building. A useful monitoring plan follows the path of the water and the places where control can be lost:
- At the storage vessel or heater outlet — to confirm hot-water generation conditions.
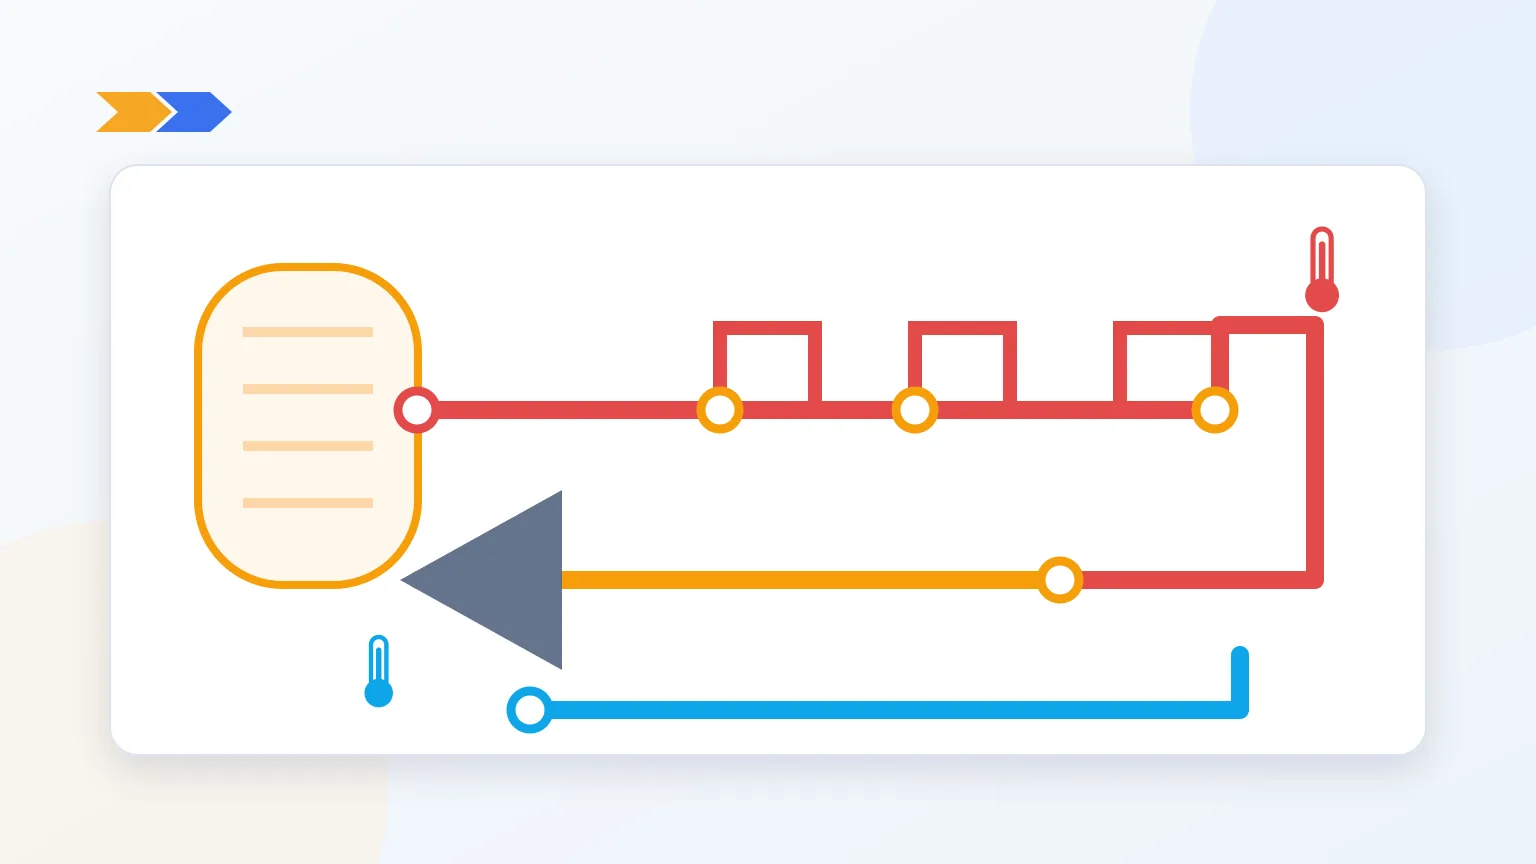
- On circulation flow and return — the temperature difference helps show whether the loop is reaching remote parts of the system.
- At representative terminal outlets — especially the furthest, highest and hydraulically disadvantaged branches.
- At low-use points — out-of-service rooms, seasonal wings, spare bathrooms and terminal pipework are more exposed to stagnation.
- On cold water where heat gain is plausible — shared risers, warm technical spaces and low-flow branches deserve attention.
Locations should not be selected by placing “the same number on every floor”. They should follow the hydraulic diagram and the facility's risk assessment. In a large estate, a building–floor–zone hierarchy like the one described in our guides to multi-site monitoring and sensor floor plans makes the data easier to act on. Every point also needs an unambiguous name: “DHW circulation return, wing B” is more useful during an incident than “Sensor 17”.
Turning a reading into an alarm that leads to action
A chart alone does not control a water system. Every alarm needs an agreed interpretation and response. A low circulation-return temperature, for example, may point to a failed pump, poor hydraulic balancing or a period of unusually high draw-off. A rise in cold-water temperature may indicate stagnation or heat transfer in a riser. The monitoring system identifies the point, the first out-of-threshold result and the history of change; staff determine excursion duration from that history under the approved procedure, while the technical team confirms the diagnosis.
A brief fluctuation during draw-off has a different meaning from two hours of return-loop cooling, but a simple Nextriv threshold is not duration-aware. Every reported result is evaluated immediately, without a trigger delay, debounce or hysteresis. Staff distinguish a brief change from a sustained excursion using the history and the approved procedure; where automatic time-based logic is required, it needs to be designed and validated separately. Timing in Nextriv applies only to later escalation steps after an event has been created. Loss of data needs its own treatment as well: a silent device must never look like a correct temperature. Our overview of notification channels and escalation explains how to route an event to the person who can actually respond.
A practical response procedure may include:
- confirming the reading with a separate, checked thermometer;
- inspecting the heater, circulation pump and balancing valves;
- comparing neighbouring points and the same point's historical pattern;
- starting the actions defined in the water safety plan;
- documenting the cause, decision and verification result;
- escalating to the person responsible for water hygiene where required.
Choosing the measurement method
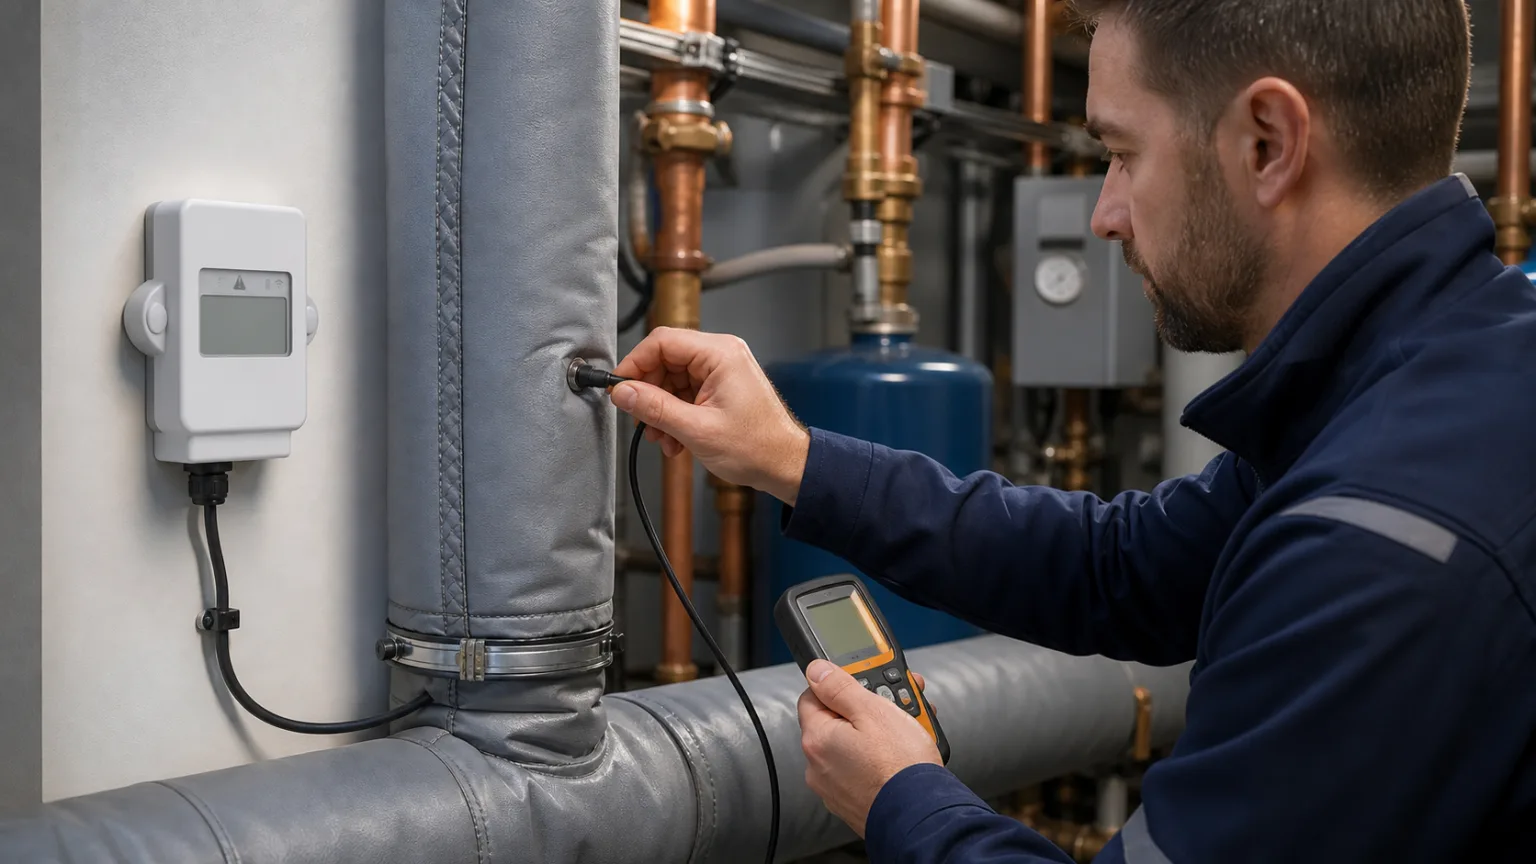
Temperature may be measured on the pipe surface, in a thermowell or by an immersed probe. The right method depends on the installation design, required accuracy and material approvals. A surface-mounted sensor responds differently from a probe in the water, so results from the two methods should not be compared without considering that difference. Insulation, thermal paste, immersion depth and the location relative to a mixing valve can affect the result more than the electronics' stated accuracy.
At suitable technical points, an RTD probe such as the Nextriv Probe PT100 may be considered, but its installation, sheath and contact with water must be specified for the particular system. A product page does not replace confirmation of material suitability or a properly designed measurement point. Metrological control matters just as much: periodic comparison and traceability are covered in our guide to temperature sensor calibration.
The recording interval also follows the risk. Sampling every few minutes may represent circulation dynamics well, while another site may justify a longer interval combined with immediate evaluation of every report. Sampling and reporting should be separated only for a device model that supports a local timestamped buffer and less frequent transmission; otherwise they are one rhythm. Loss-of-connectivity detection remains a separate setting. The configuration is fit for purpose only if it detects a meaningful change before the response time in the procedure has elapsed.
What central Nextriv monitoring contributes
Multi-point monitoring brings the installation onto one dashboard, preserves history and routes an event to the responsible person. A technician no longer needs to copy temperatures from dozens of risers each day, and a facility manager can see whether a problem is local or affects the whole loop. The benefit grows across an estate, where consistent point names, thresholds and response workflows make hotels, clinics or care homes comparable. See the buildings solution for the broader facility-management context.
The boundary remains explicit: Nextriv records temperature and operating events. It does not detect Legionella, interpret a microbiological result or replace a water safety plan. Its role is to reveal conditions that merit attention sooner, document the response and show whether the intervention restored the intended operating state.
The trend complements a manual round; it does not cancel it
Automatic recording and manual inspection answer different needs. A trend covers nights, weekends and recurring cooling, while a round lets staff check actual flow, time to reach the target temperature, valve condition and point identification. The fixed sensor should be compared periodically with a reference thermometer under equivalent conditions. A discrepancy may indicate sensor error, but it can also result from a different location or measurement method.
A monthly report should not stop at the mean. Useful evidence includes minima and maxima, time outside the target band derived from the reading history, missing data and a list of points with recurring problems. This review can support circulation balancing or pipework improvement before one-off alarms become routine. It still needs to be considered alongside microbiological results, flushing records and the actions in the water safety plan.
Implementation checklist
Before switching on alarms, approve six items: the current system diagram, representative and critical points, probe installation method, thresholds evaluated immediately on every report, recipients and timing of subsequent escalation steps after an event, and the response procedure. Then perform a comparison measurement, test both an excursion and a connectivity loss, and review the trends after several weeks. If the furthest riser cools at the same time every night, that is valuable operating evidence even when no individual reading initially looks dramatic.
If you want to translate a water-system diagram into measurement points and an actionable dashboard, book a Nextriv demo. We will start with risk and response, not an arbitrary sensor count.